GIS Analyst | Oral Health Researcher | Public Health Data Storyteller
I use GIS, spatial statistics, and public health data to uncover where health inequities exist — and create interactive tools that help communities and decision makers act on them.
About
I'm an internationally trained dentist with five years of clinical practice, turned public health researcher. After earning my MPH at Saint Louis University in 2026, I shifted focus from treating individual patients to understanding the structural conditions that determine whether people can access care at all.
My research combines GIS, spatial statistics, and public health data to build tools that expose oral health inequity across communities. I taught myself ArcGIS Pro to do this work independently — and my redlining overlay analysis was liked by Esri's official account on LinkedIn.
I'm currently seeking roles in public health research, GIS analysis, health equity, and oral health policy — especially positions that bridge clinical knowledge with population-level data science.
Featured Interactive Maps
These live tools go beyond static images — click through census tracts, toggle layers, and see the data behind the maps.
Interactive · ArcGIS
St. Louis Oral Health Vulnerability Index
340 census tracts. Eight SDOH indicators. One composite index showing where oral health burden is highest across City and County.
Explore map ↗
Interactive · Redlining Analysis
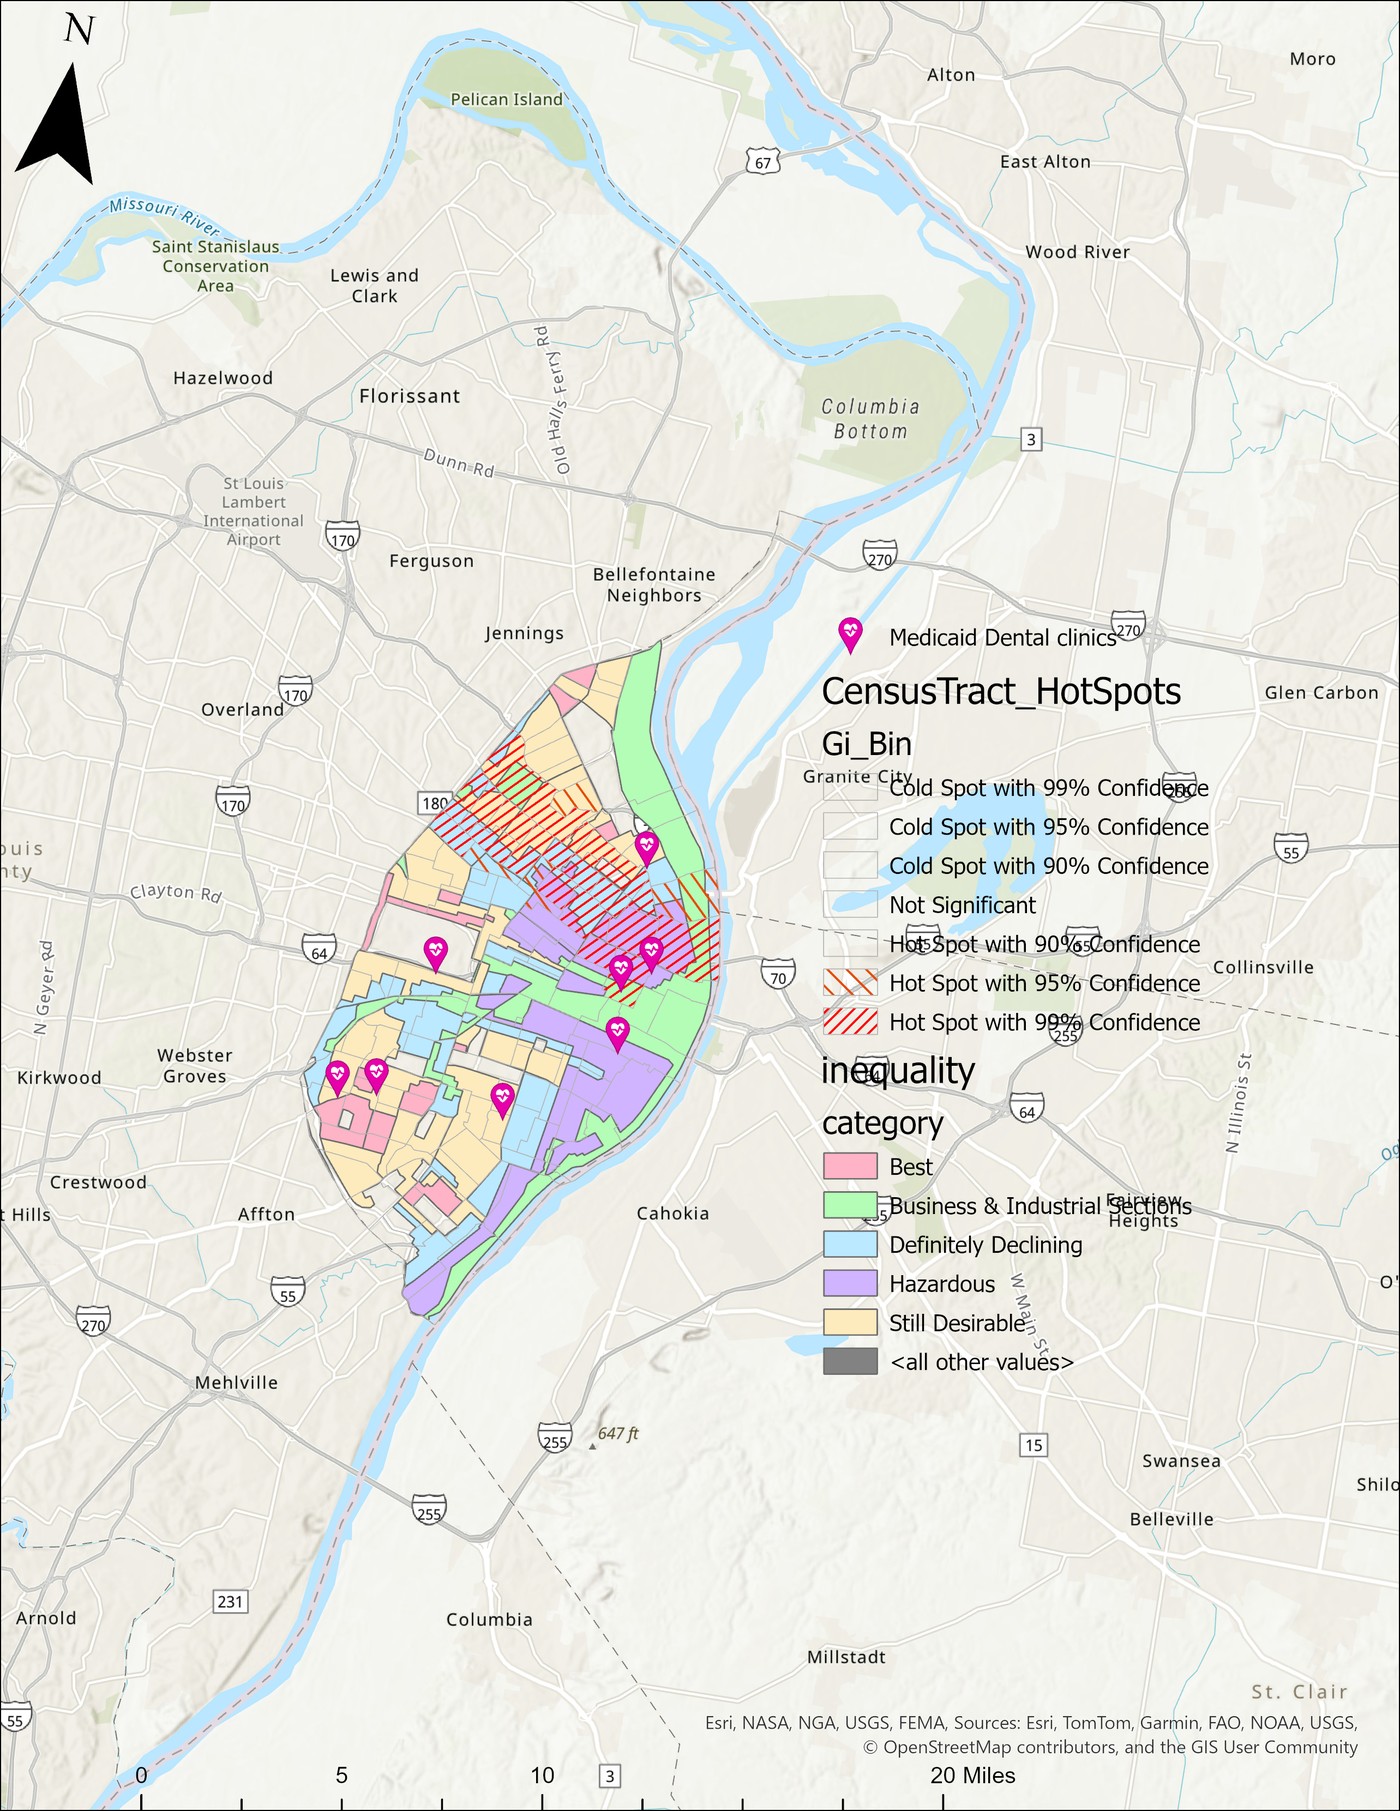
3D Redlining & Vulnerability Map
1937 HOLC redlining grades overlaid on today's oral health hot spots. Liked by Esri on LinkedIn.
Explore map ↗
Interactive · 3D Extrusion
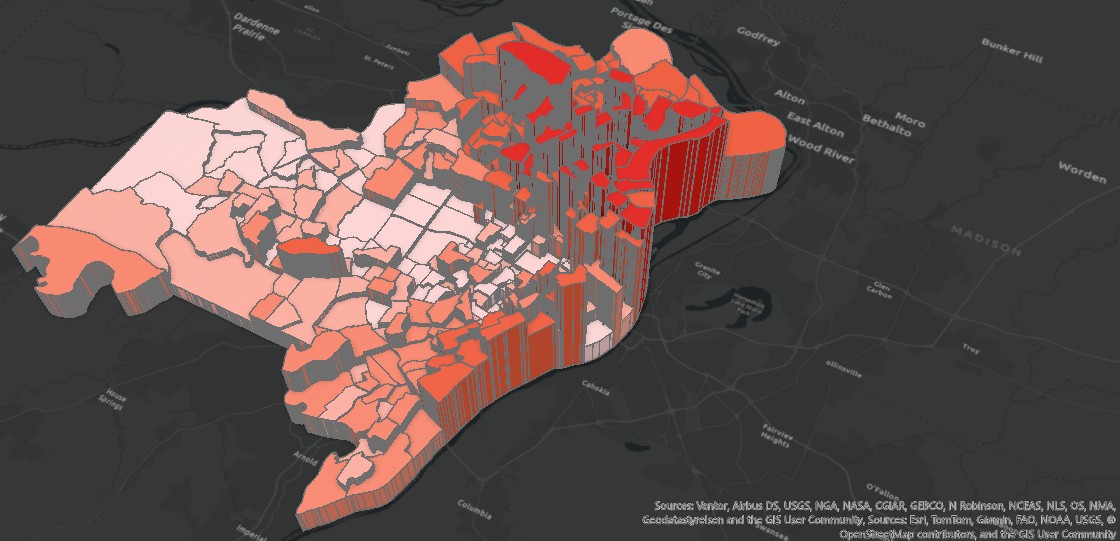
Skyline of Health Inequity
Height = tooth loss. Color = vulnerability. The tallest towers rise in North St. Louis — a 3D portrait of inequality.
Explore map ↗
Interactive · Hot Spot Analysis
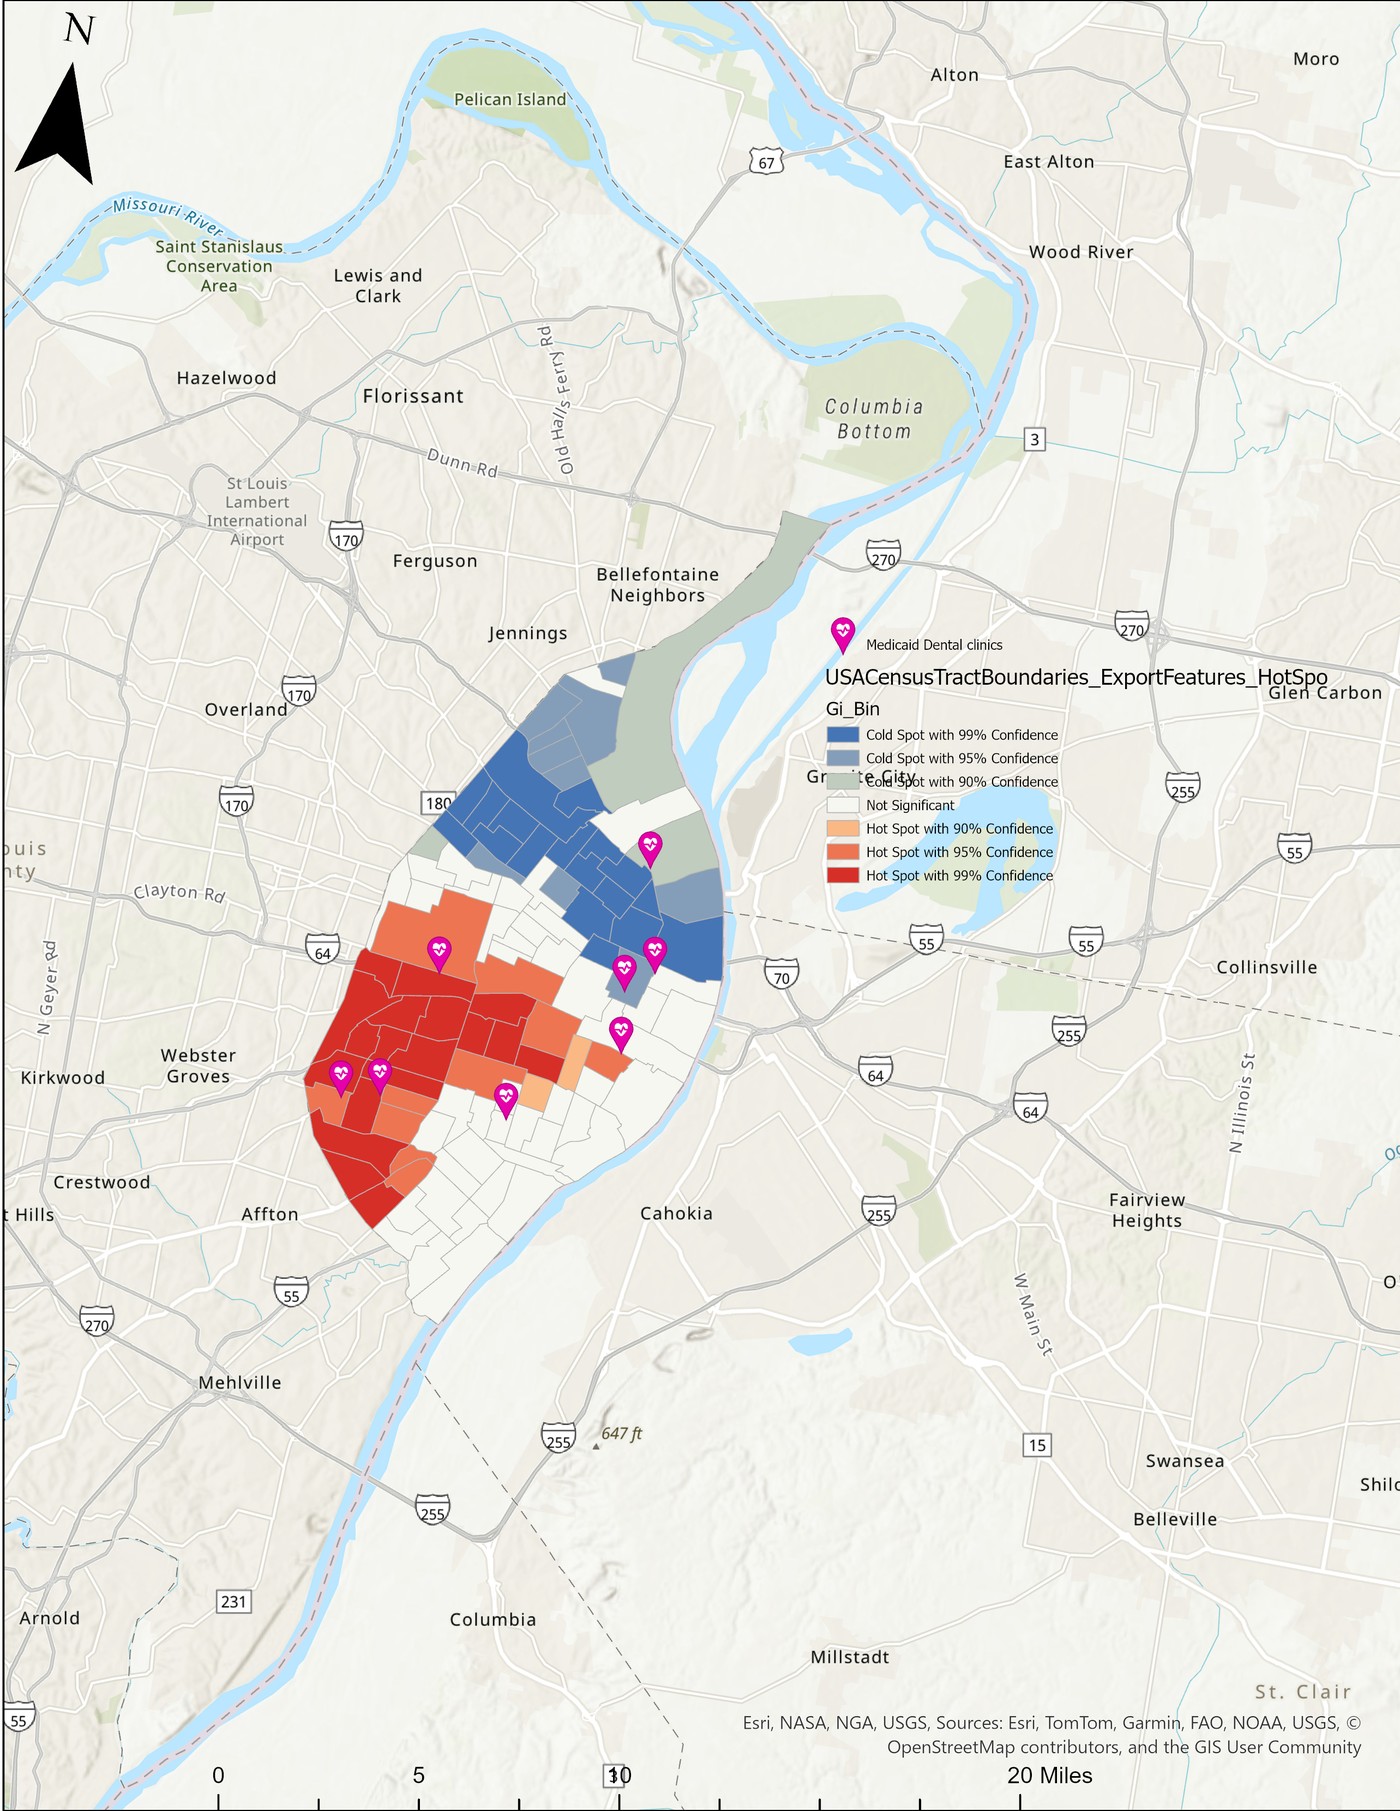
Medicaid Dental Access Dashboard
Hot spot clusters of tooth loss and dental visit rates across St. Louis City, confirmed at 99% statistical confidence.
Explore map ↗
Interactive · 8 Risk Factors
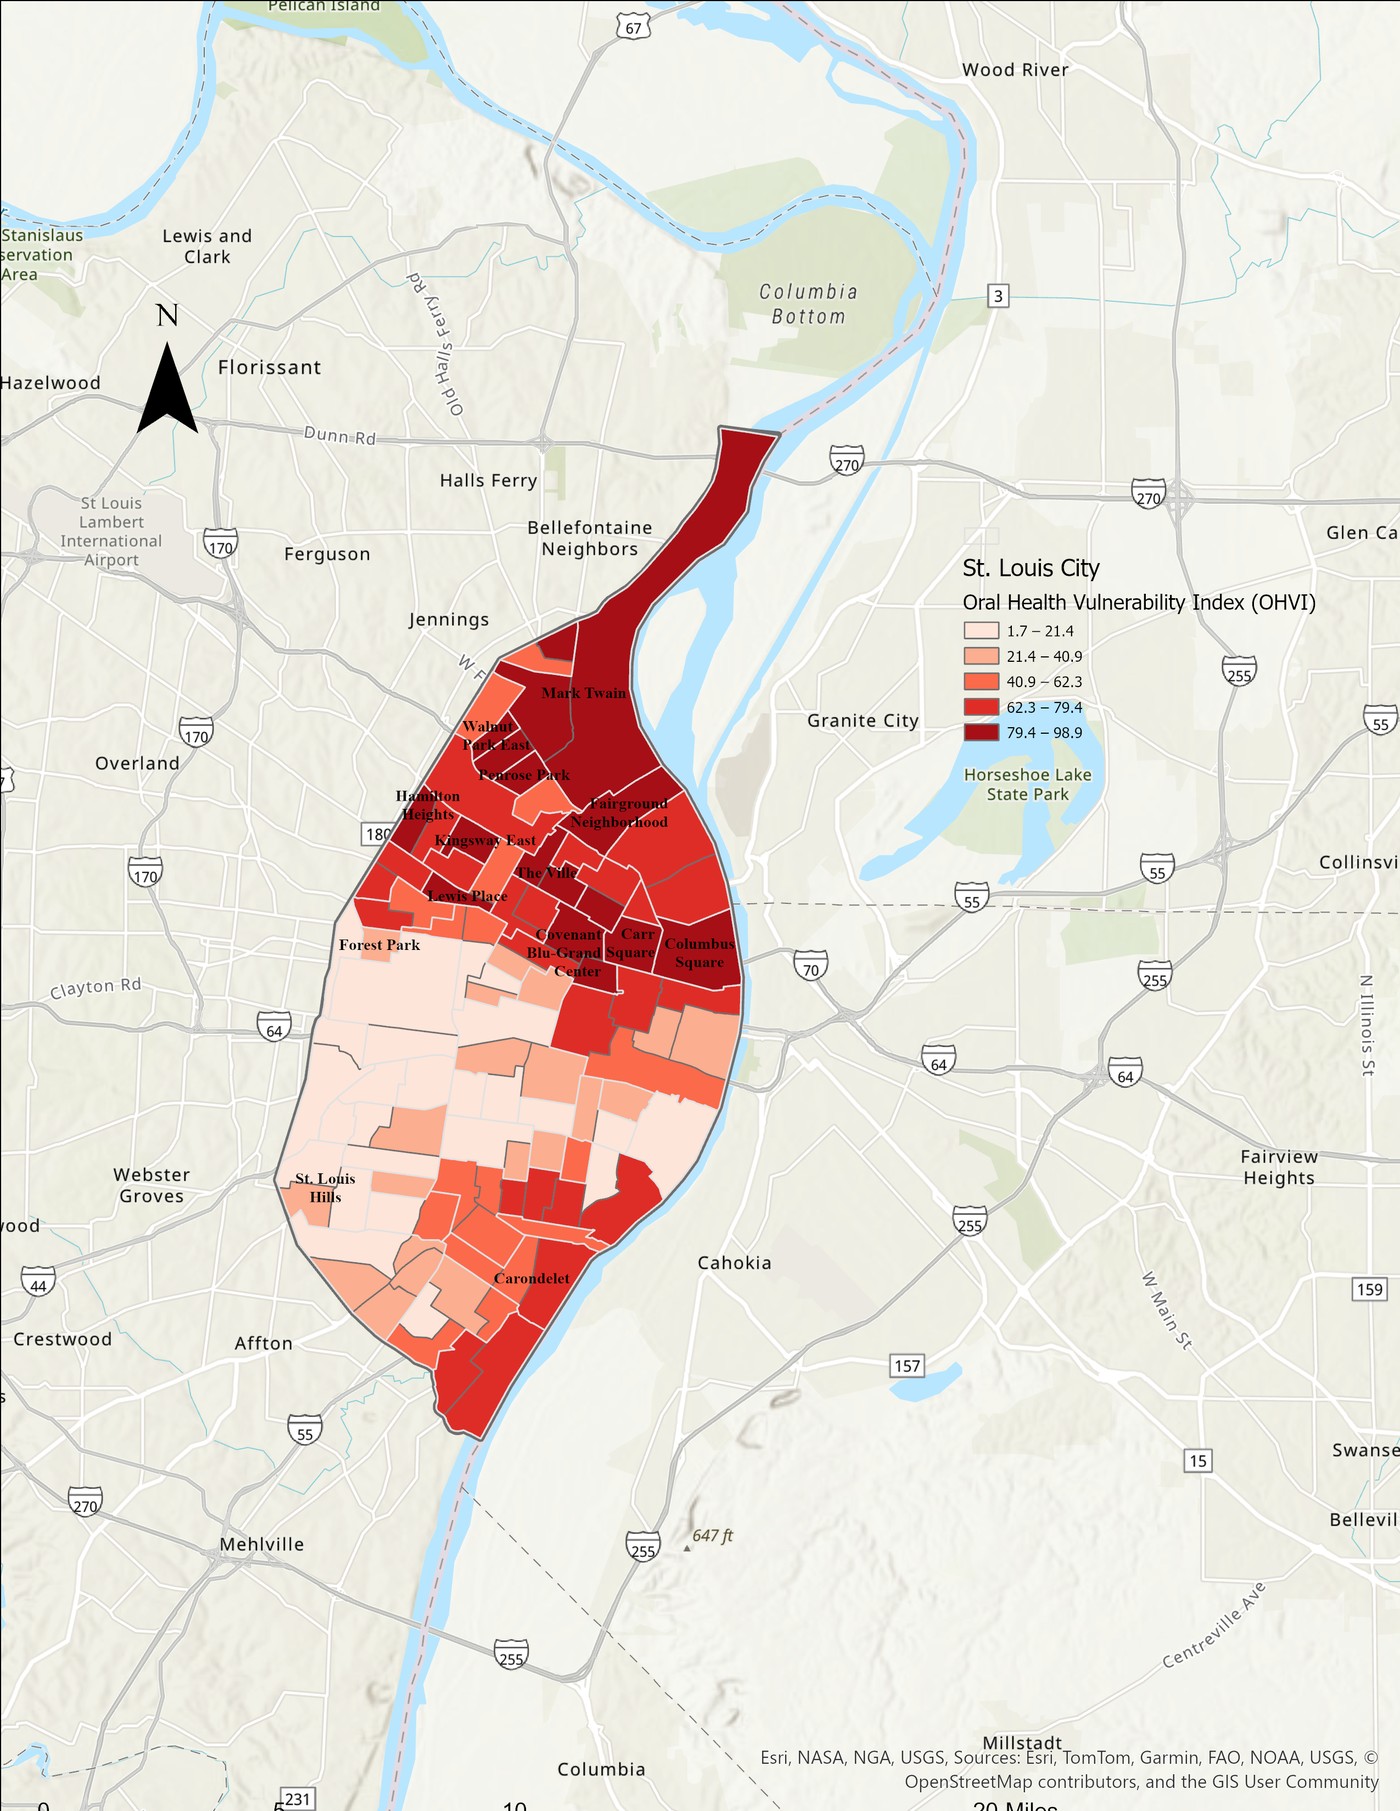
OHVI — St. Louis City (Updated)
104 census tracts. Eight risk factors. Percentile rank composite index (0–100) with neighborhood-level labels.
Explore map ↗
Interactive · Screening Tool
Dental Care Finder & Access Check
A 7-question screener that shows your ZIP-area OHVI summary and 16 phone-verified Medicaid-accepting dental clinics near you.
Explore map ↗Research Projects
Two connected projects — one capstone, one independent — building a complete picture of oral health inequity in St. Louis.
Independent Research · Post-graduation, 2026
340 census tracts. Eight social determinants. One clear pattern. This is the most comprehensive spatial analysis of oral health inequity ever conducted for the St. Louis region.
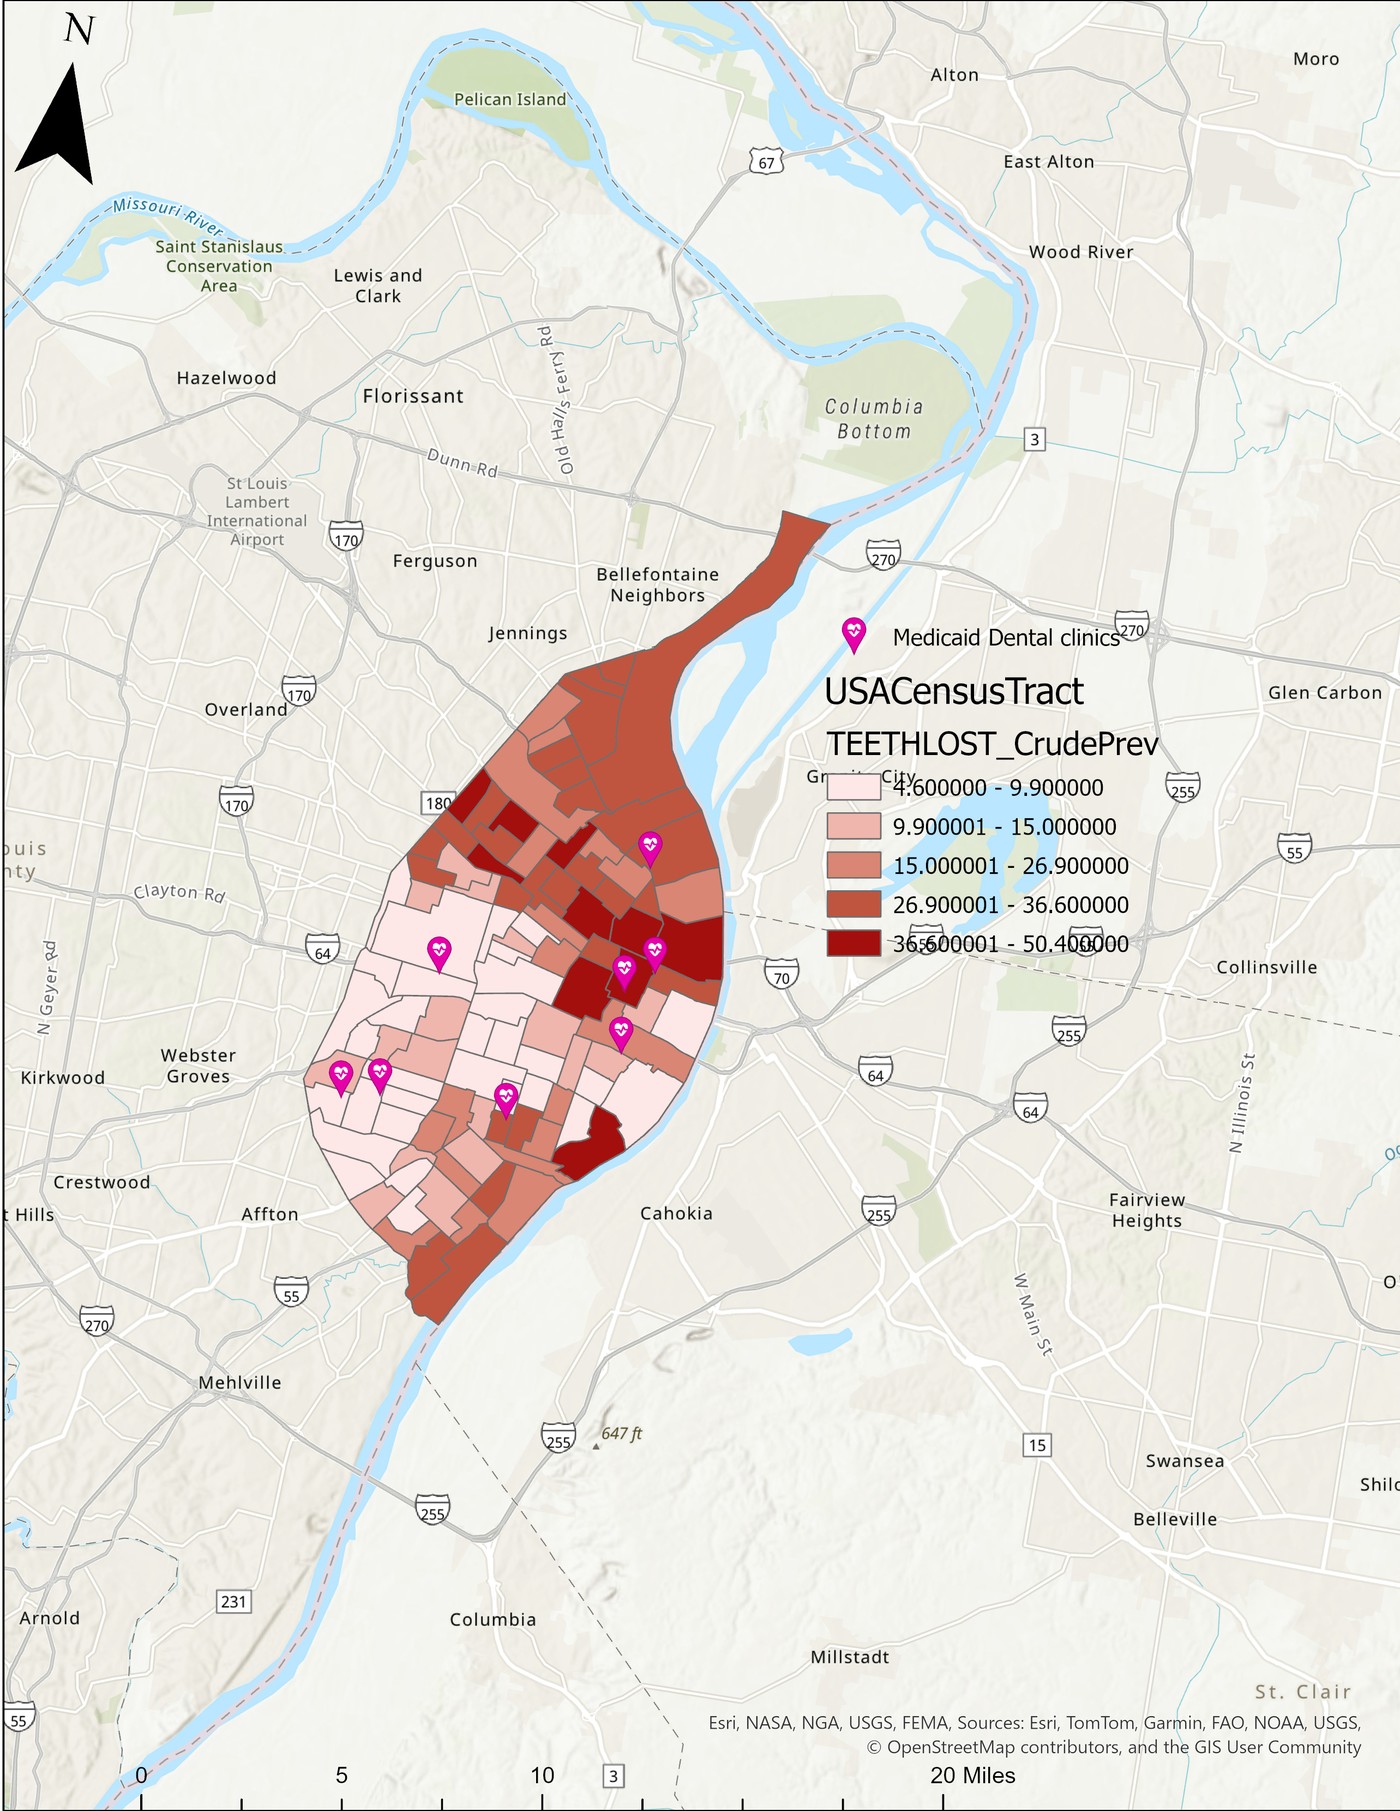
Plate 1 · Complete tooth loss · St. Louis City
Rates range from ~5% to over 50% across city tracts. Darkest red concentrations are in the north — the same neighborhoods with the fewest Medicaid-accepting clinics.
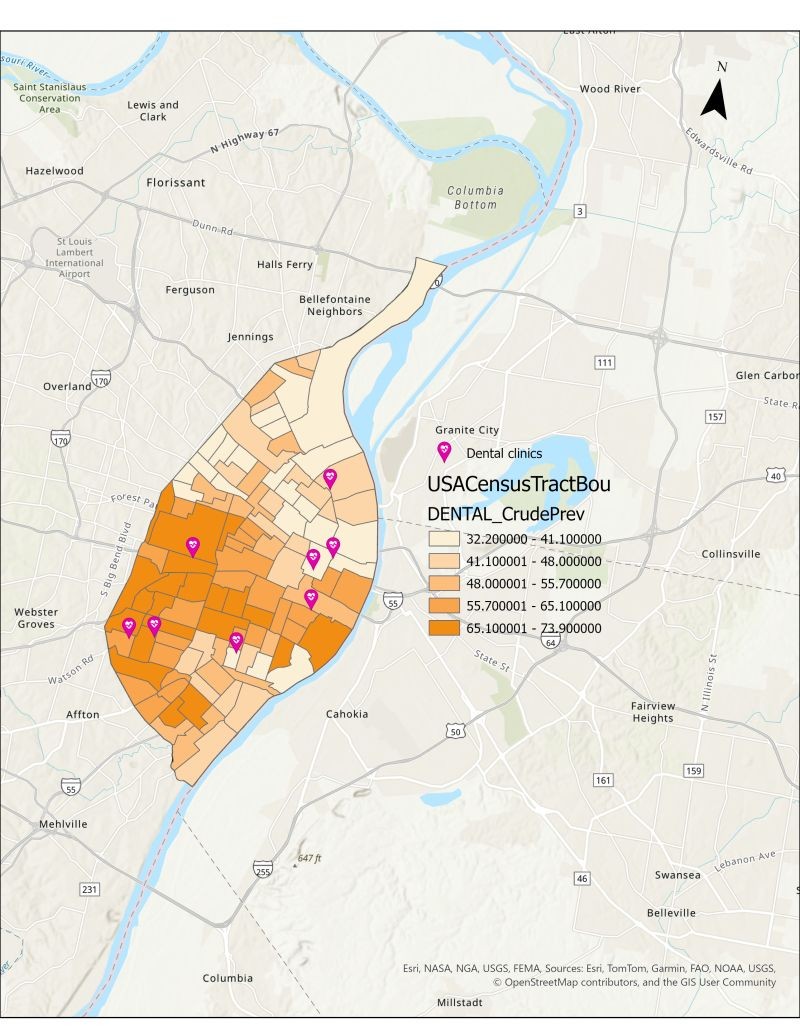
Plate 2 · Dental visit rates · St. Louis City
Visit rates range from 32% in the north to nearly 74% in the central and southern tracts where most clinics are located. When clinics are closer, people actually go.
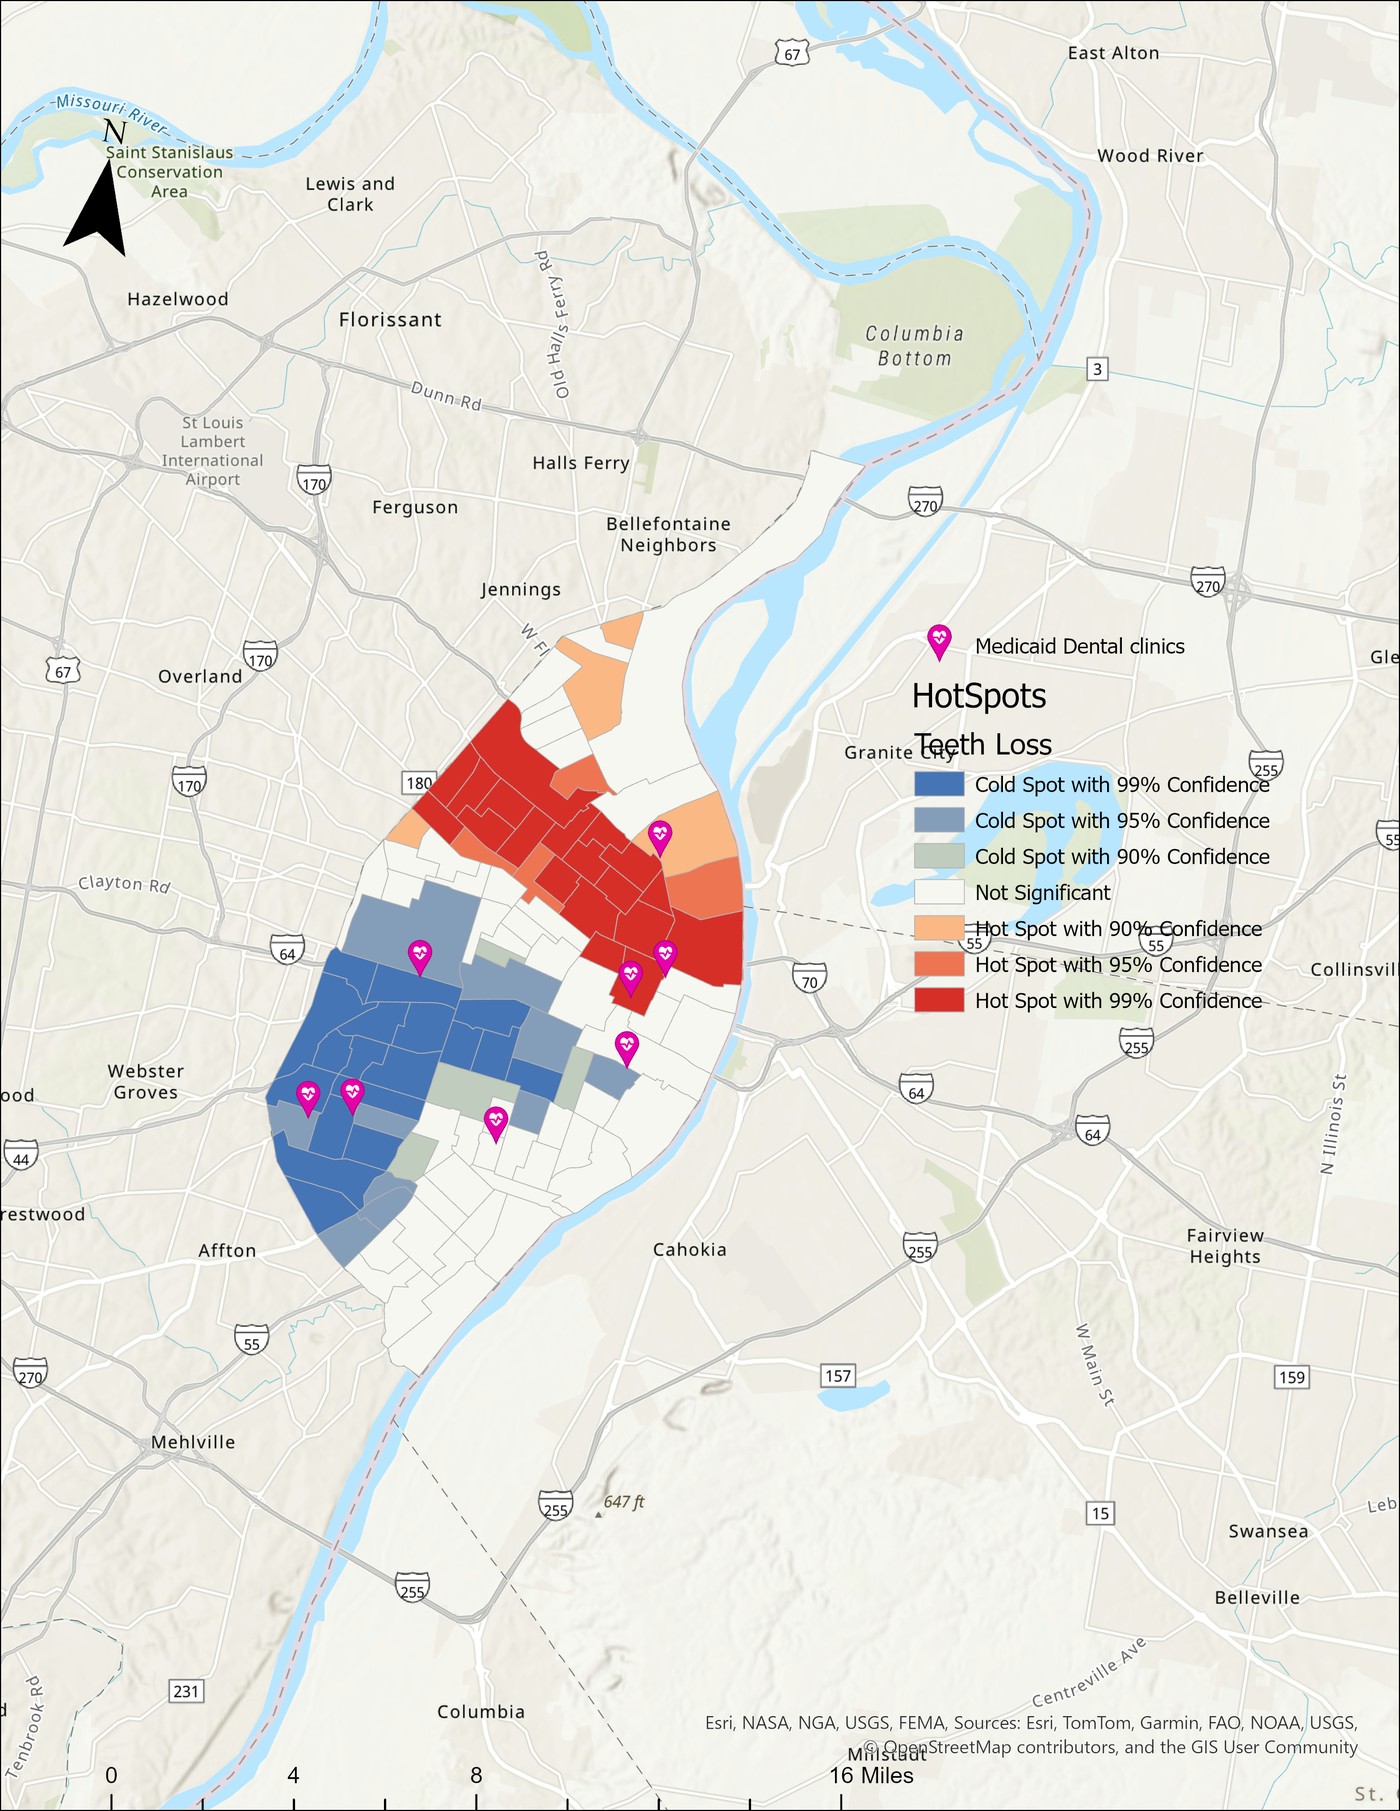
Plate 3 · Hot spot analysis — tooth loss · St. Louis City
Getis-Ord Gi* confirms northern clusters are statistically significant hot spots at 99% confidence. The southwest forms an equally significant cold spot.
Plate 4 · Hot spot analysis — dental visits · St. Louis City
A near mirror image of the tooth loss map. High-visit hot spots in the southwest, cold spots of low utilization in the north. The same divide, confirmed twice.
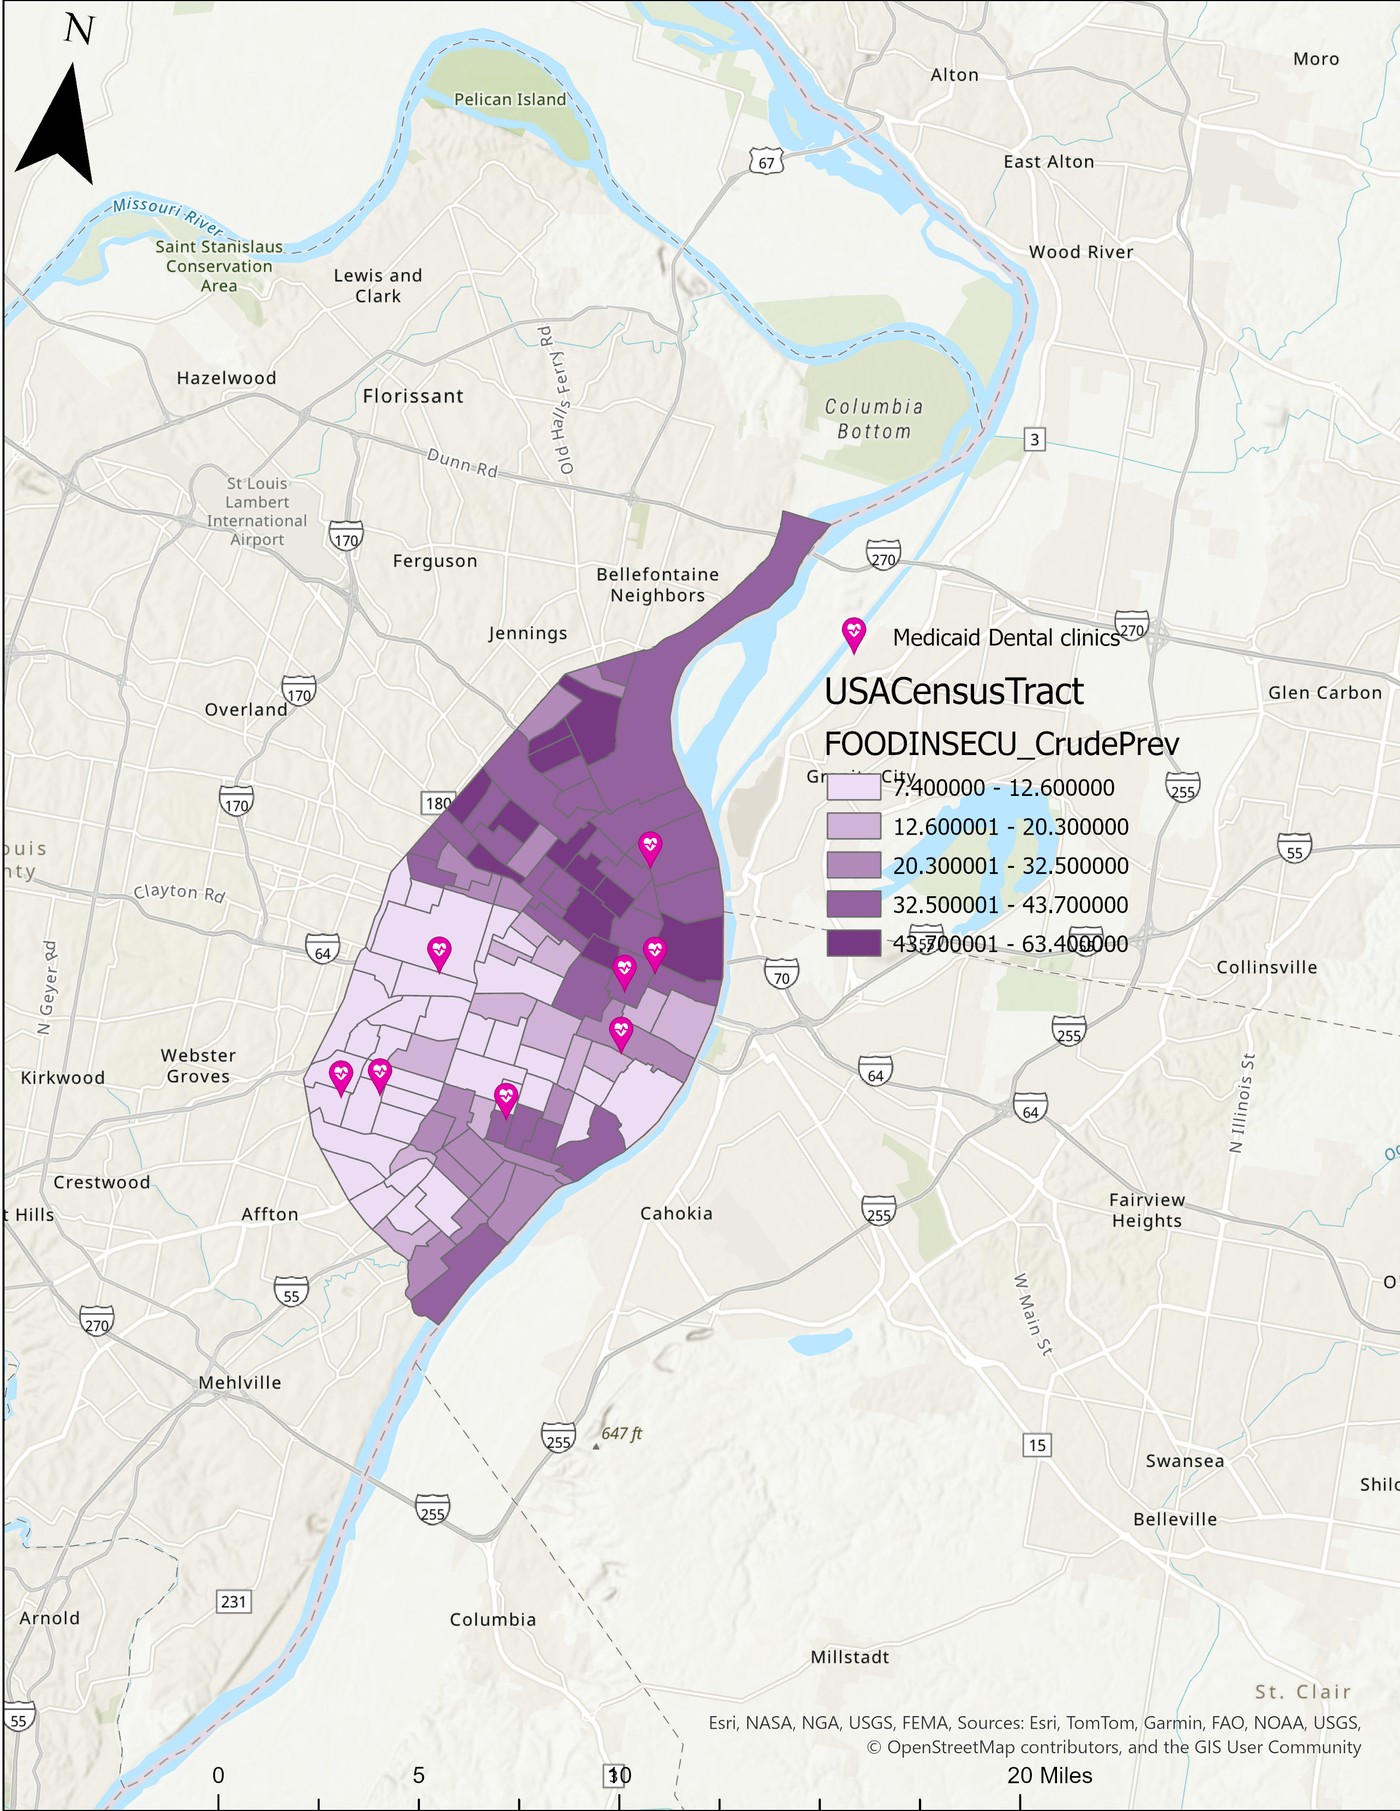
Plate 5 · Food insecurity · St. Louis City
Rates reach 63% in the hardest-hit tracts — the same northern neighborhoods with the highest tooth loss. Poor nutrition weakens teeth, and food-insecure households are the least likely to prioritize dental care.
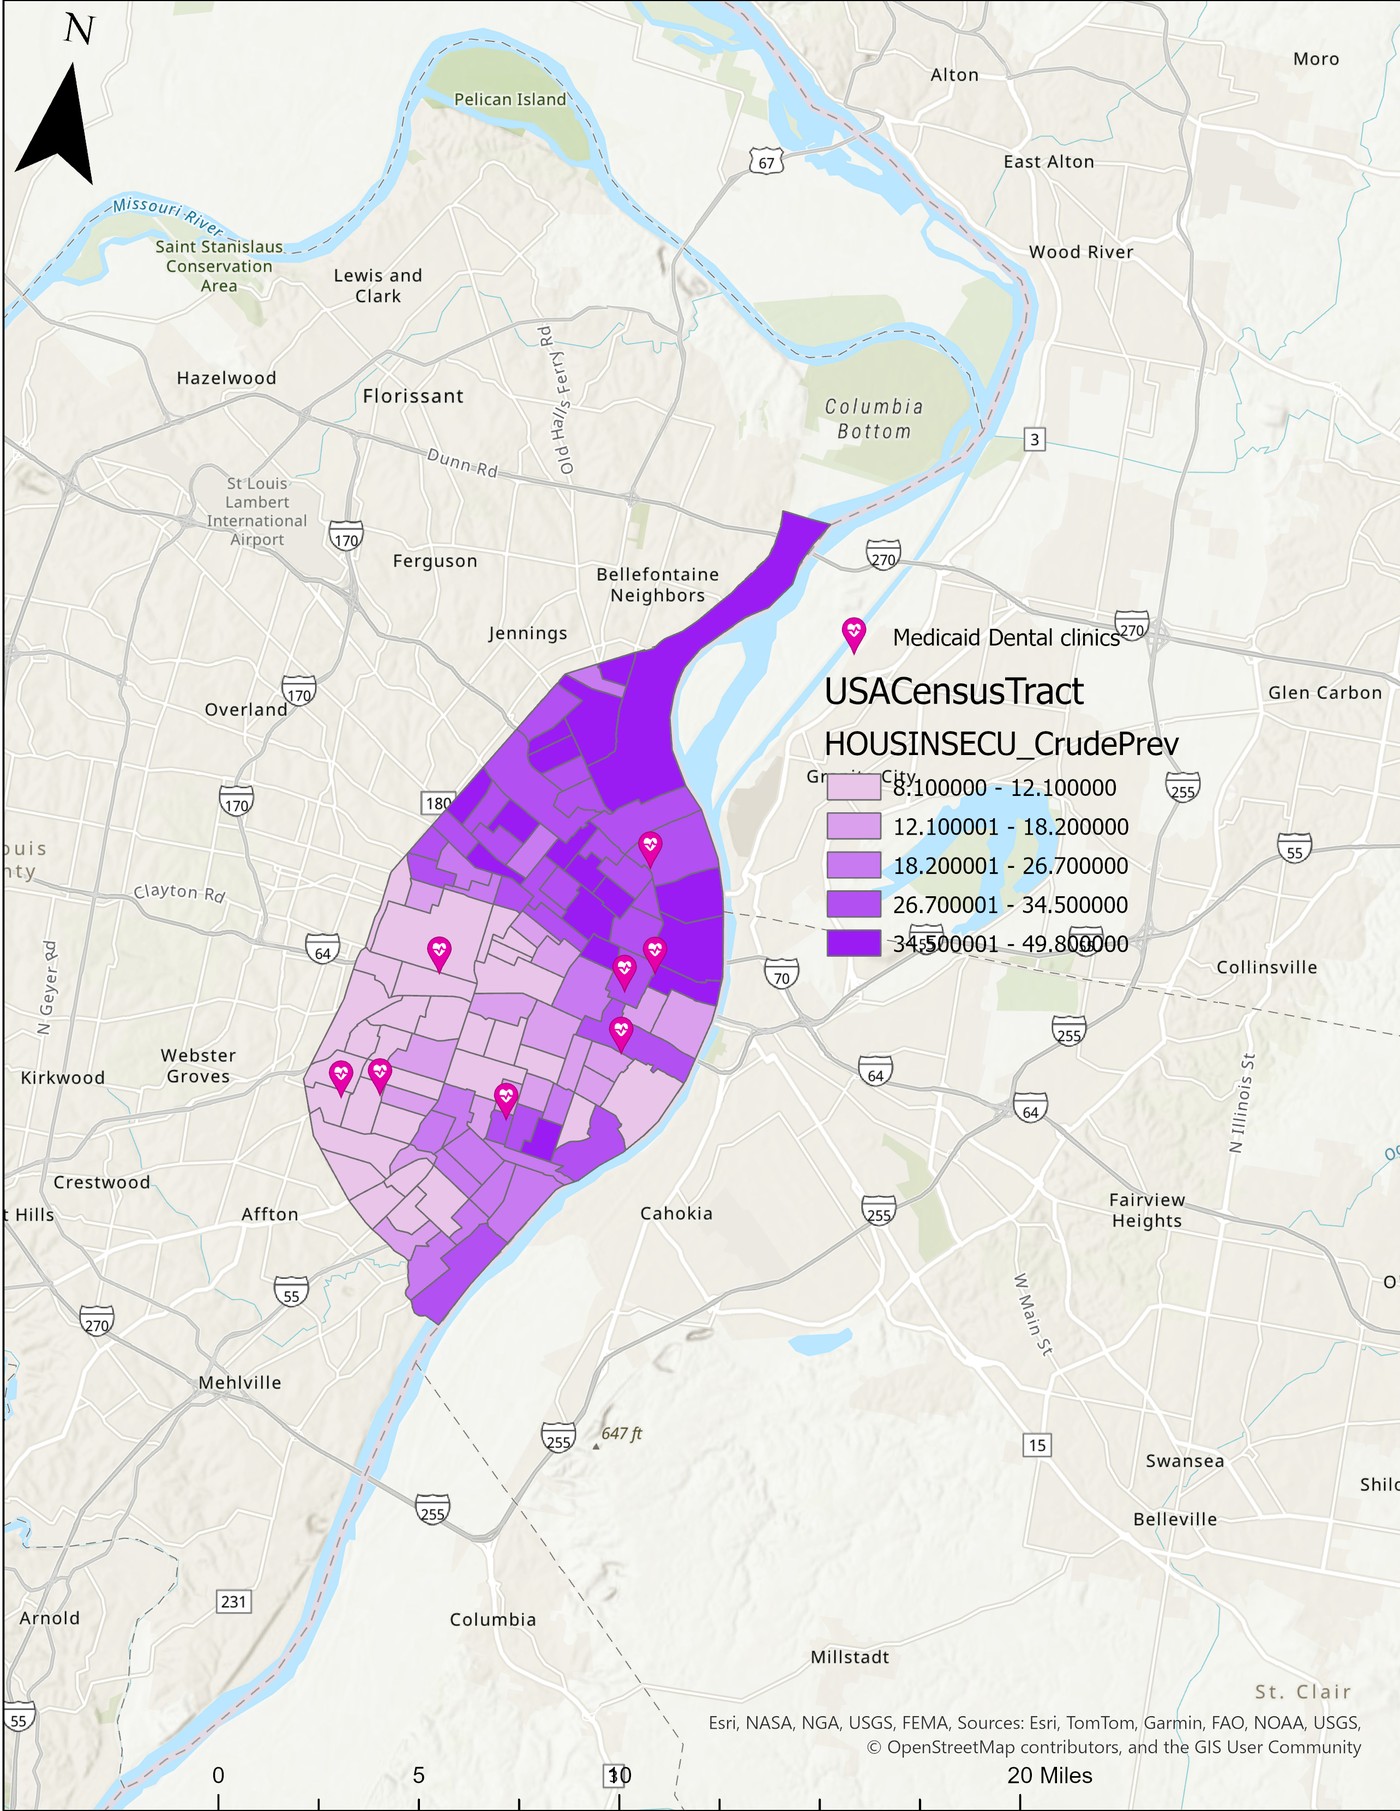
Plate 6 · Housing insecurity · St. Louis City
Housing insecurity reaches nearly 50% in northern tracts. When people are struggling to keep a roof overhead, dental care is the first thing to go.
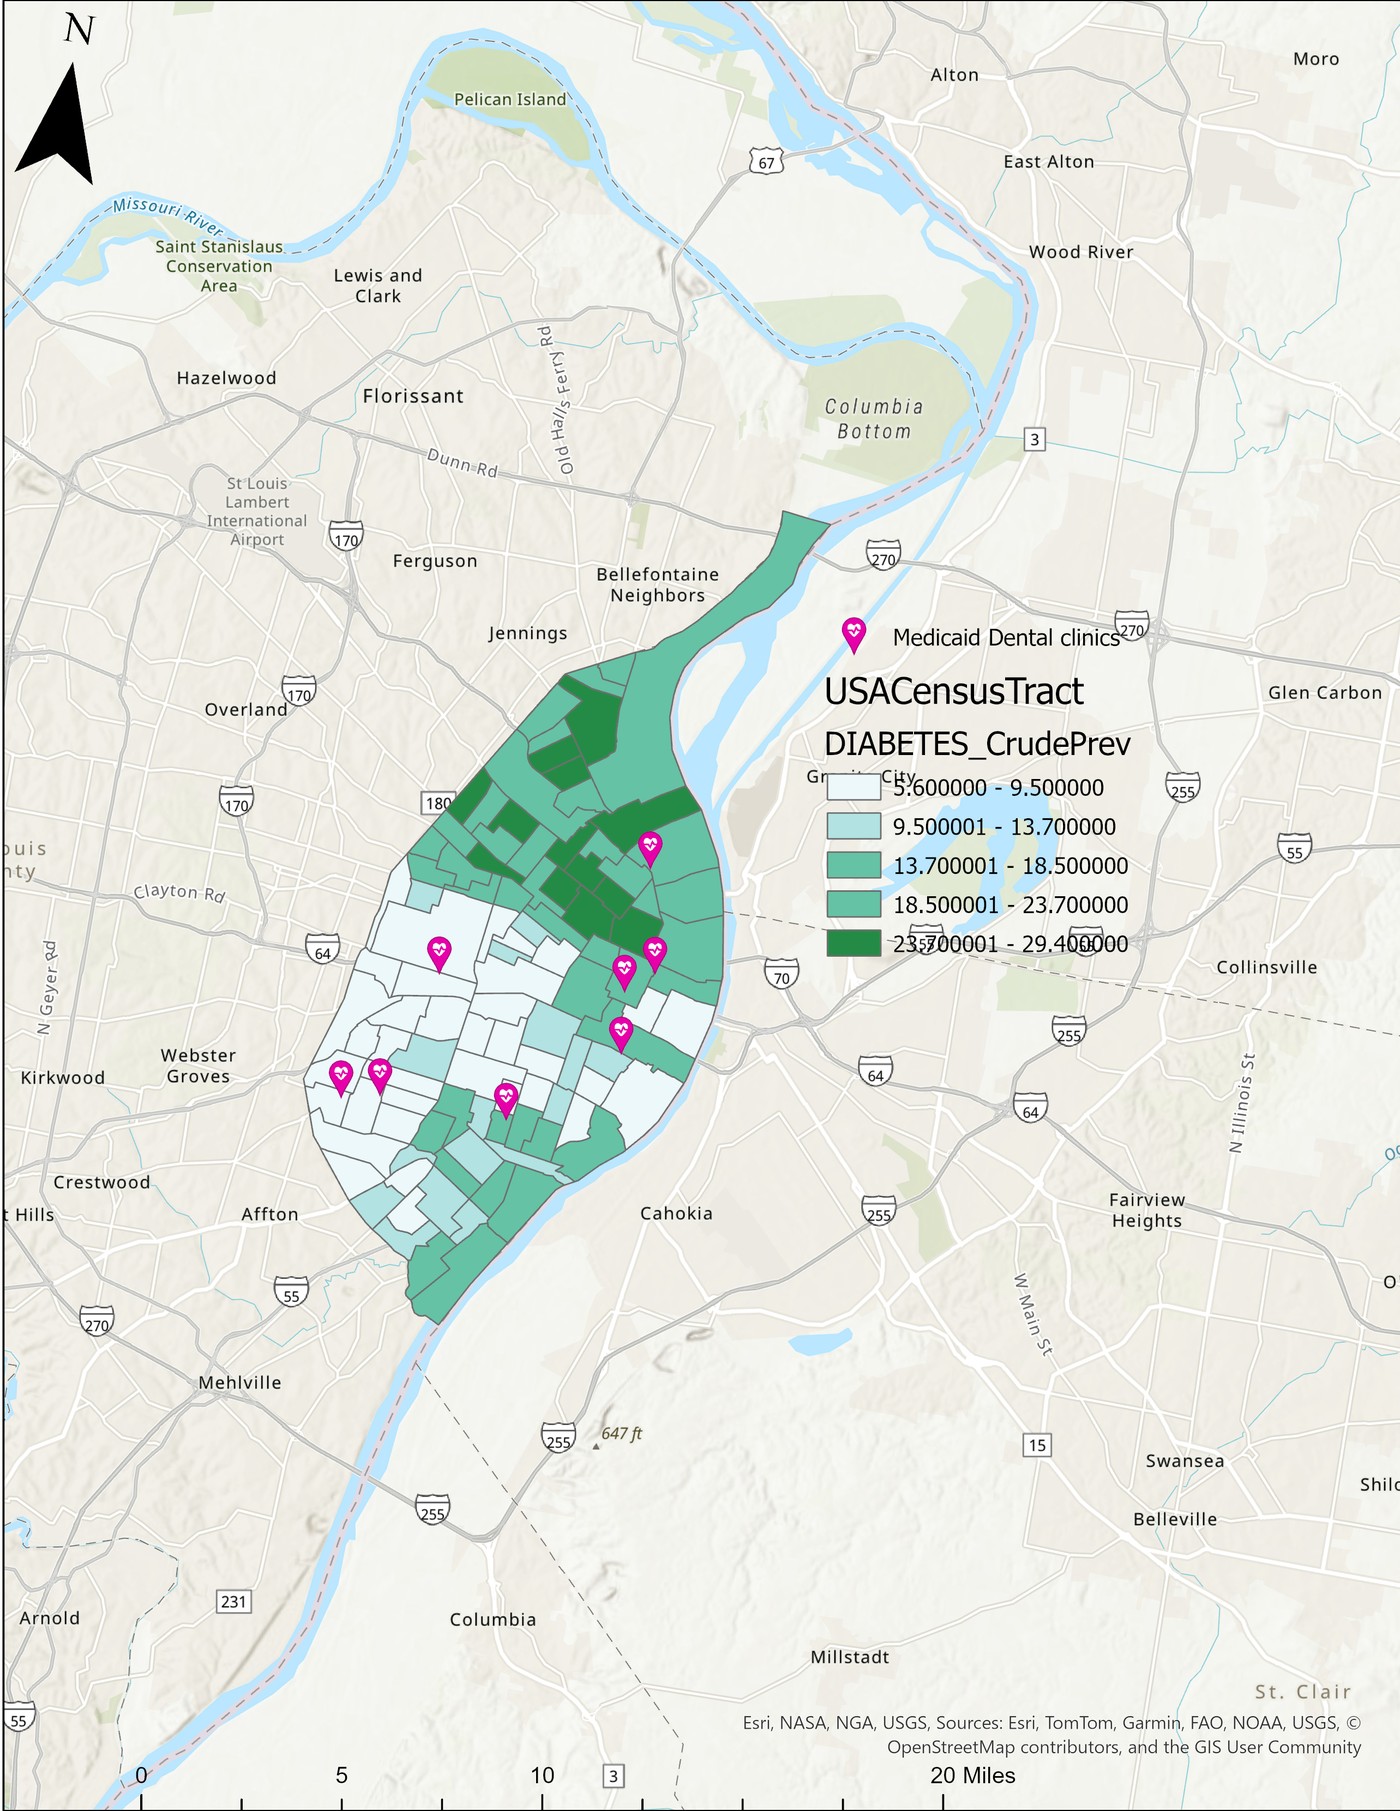
Plate 7 · Diabetes prevalence · St. Louis City
Rates reach 30% in the most affected tracts. Diabetes and gum disease directly worsen each other — and the tracts with the highest diabetes burden have the least dental access.
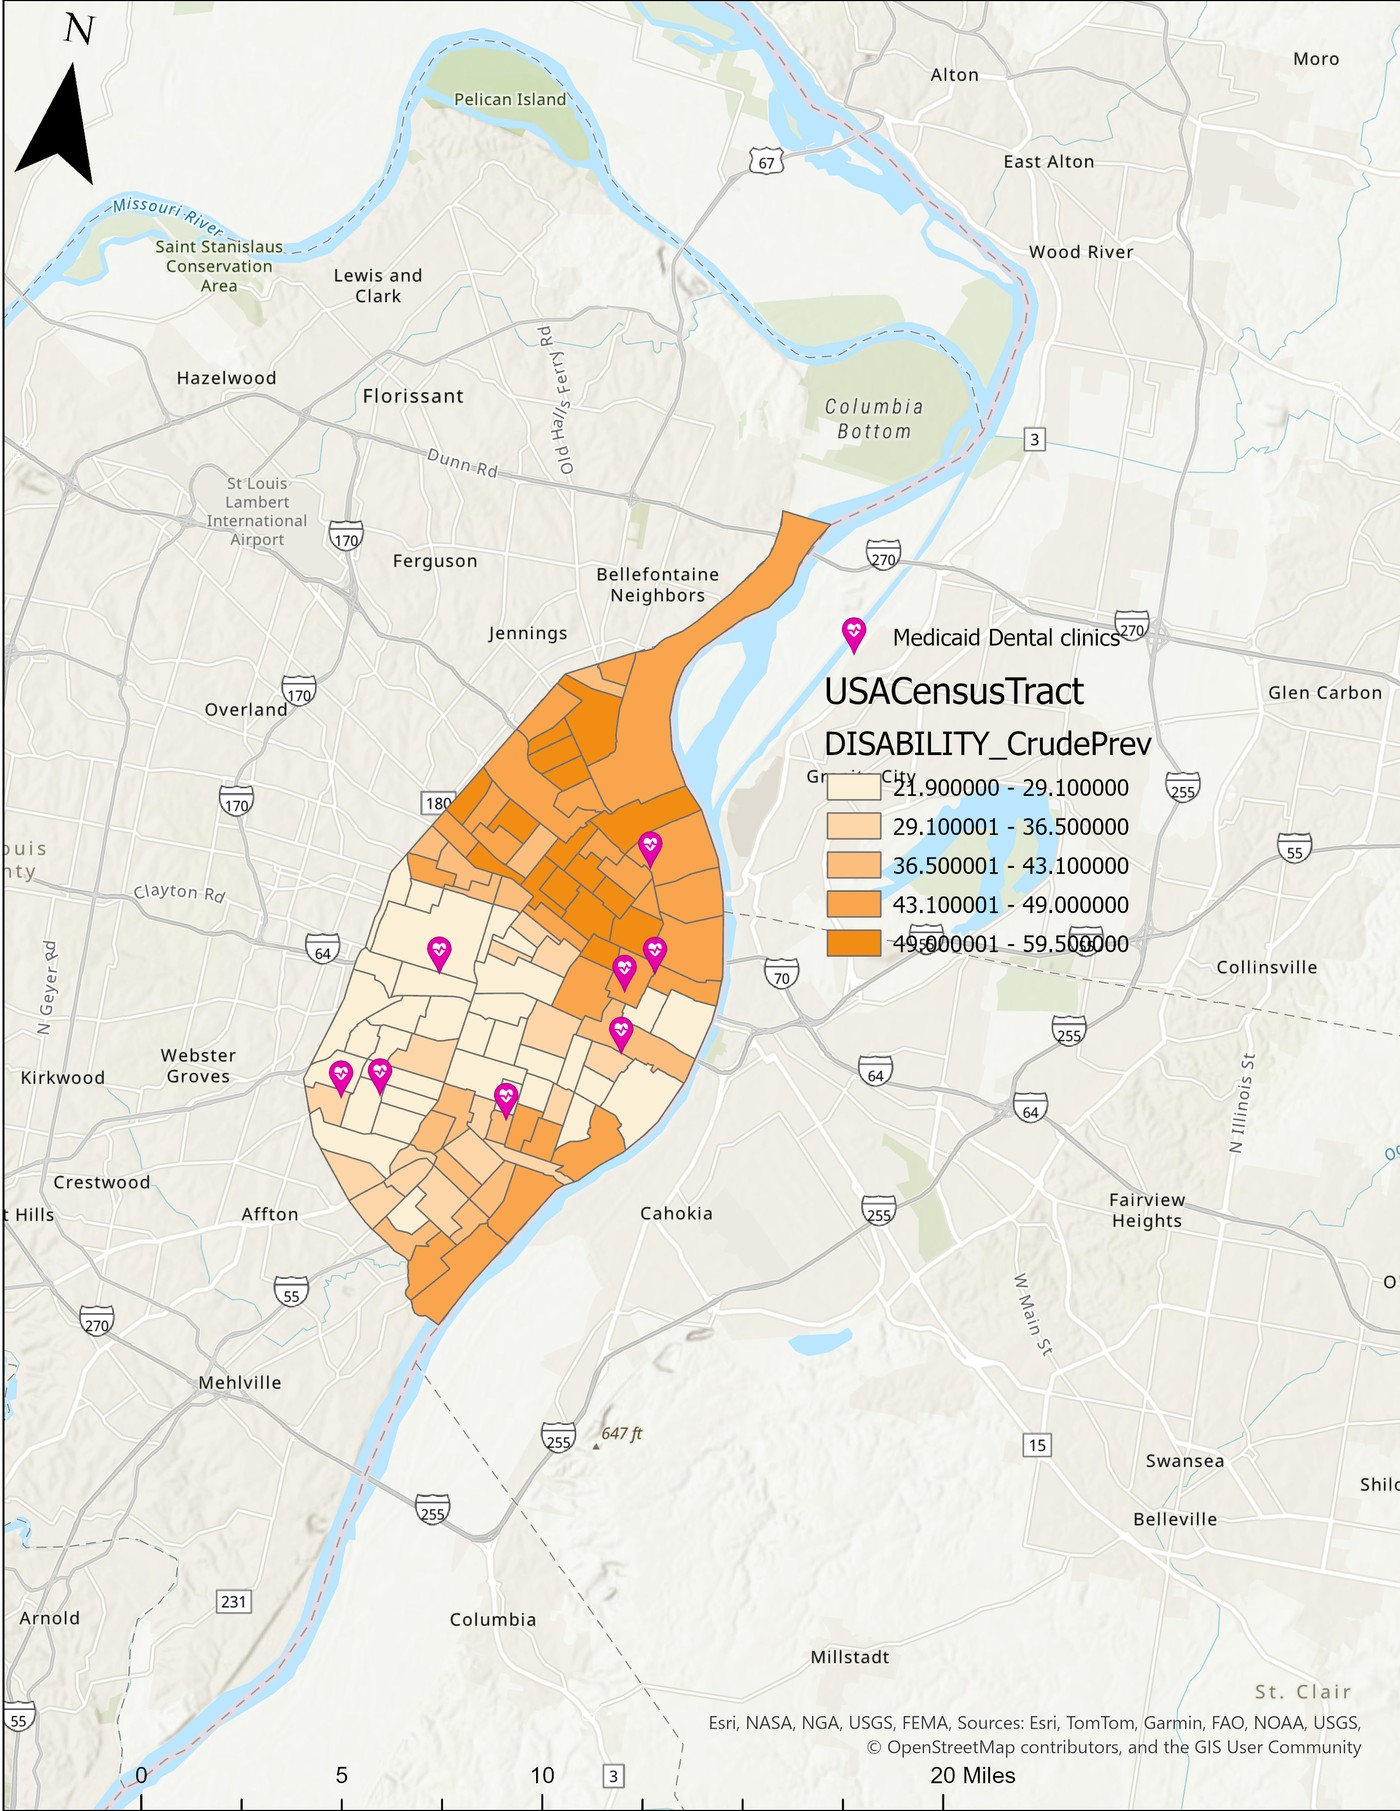
Plate 8 · Disability rates · St. Louis City
Disability rates reach nearly 60% in northern tracts — making travel to a distant clinic even harder when no nearby option exists.
Plate 9b · Oral Health Vulnerability Index with Neighborhoods · St. Louis City
Updated OHVI combining eight risk factors into a percentile rank composite score (0–100) across 104 census tracts. Neighborhood labels highlight the highest-burden areas: Mark Twain, The Ville, Kingsway East, Hamilton Heights, Lewis Place, Covenant Blu-Grand Center, Columbus Square, and Carondelet. Explore the interactive version at stlouis-ohvi.vercel.app.
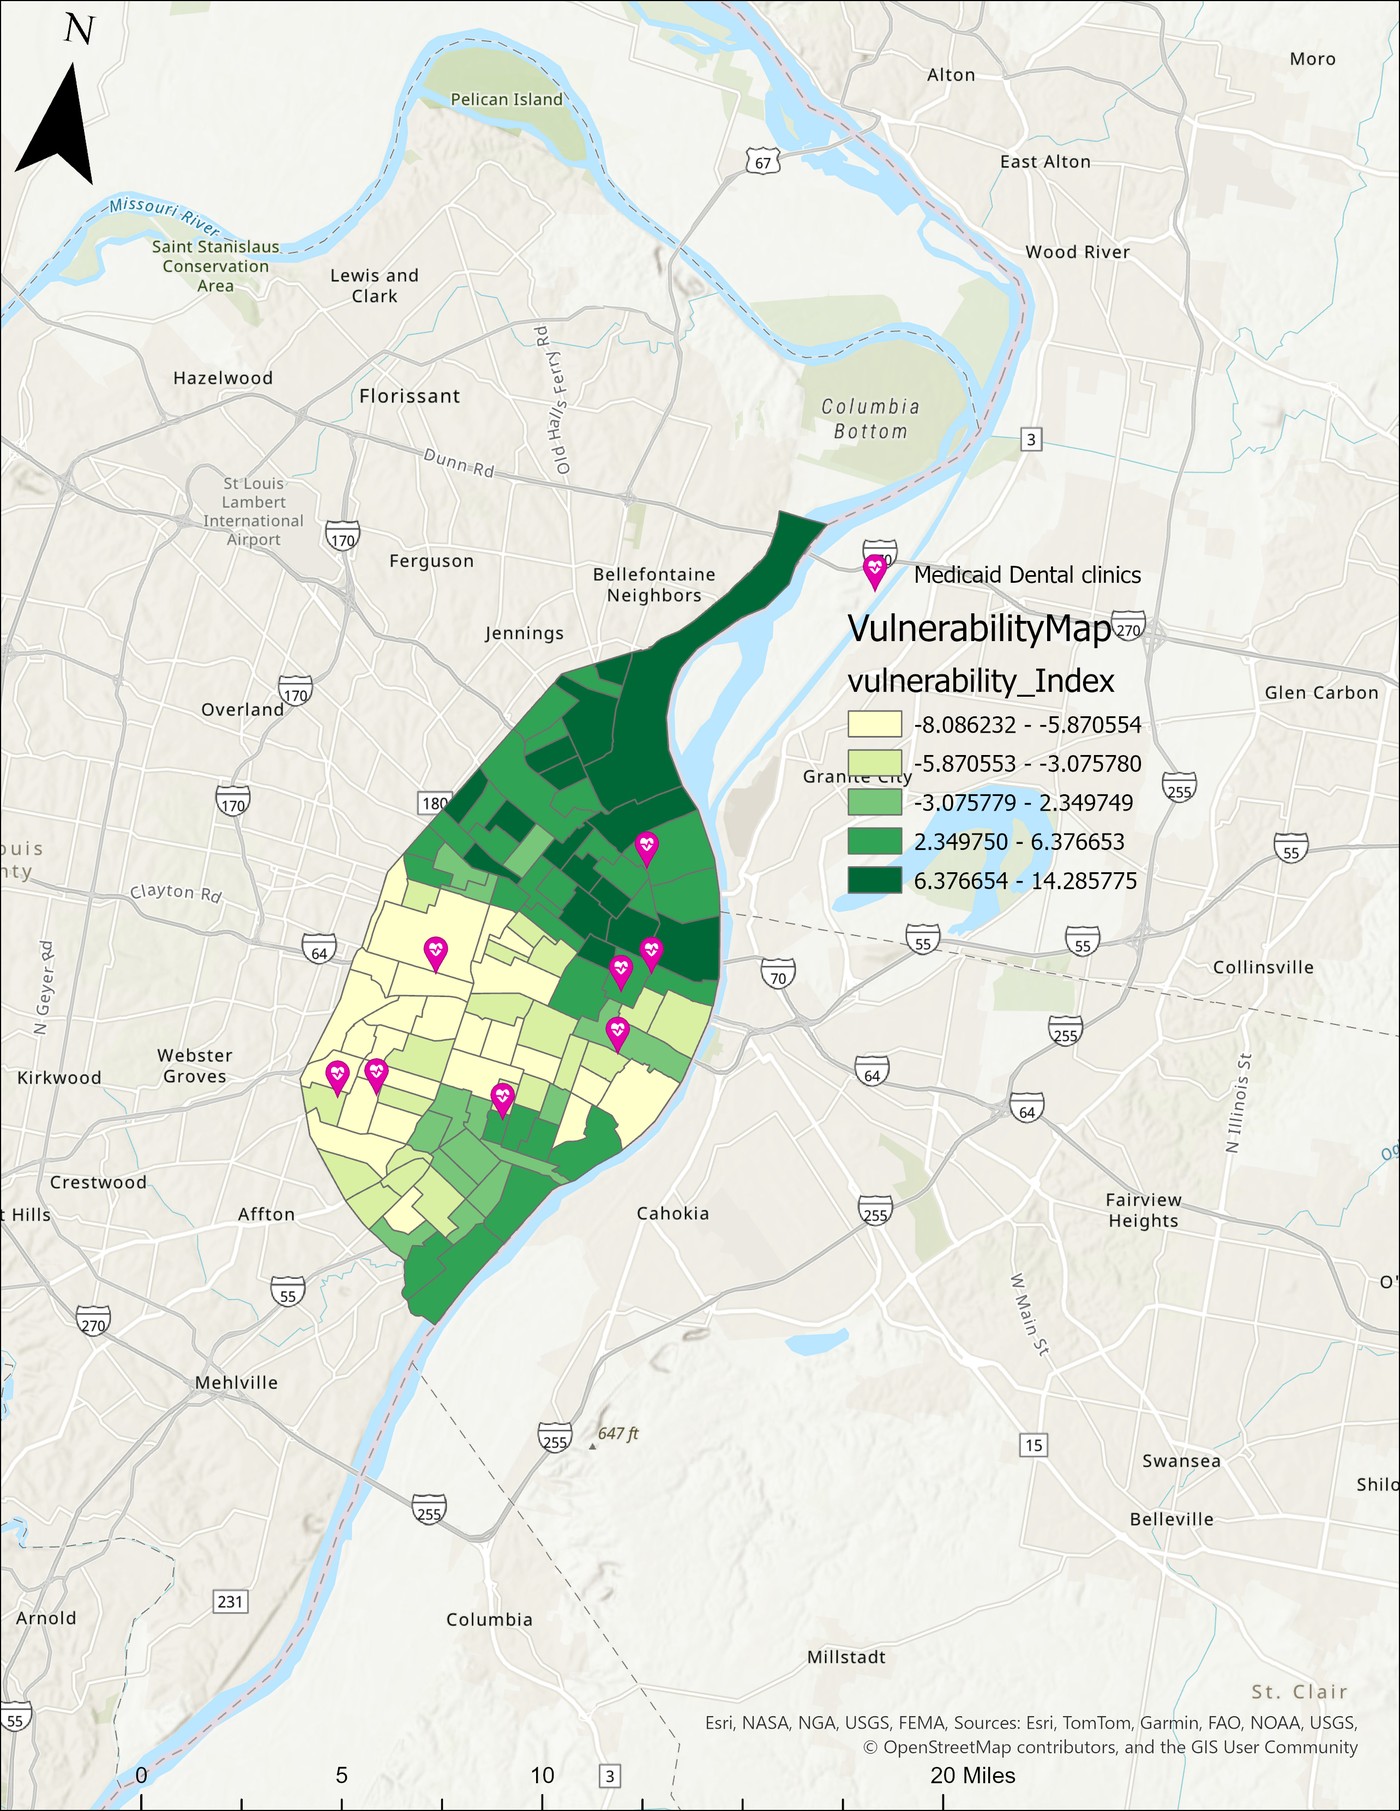
Plate 9 · Oral Health Vulnerability Index · St. Louis City
All eight indicators combined into one z-score index. Darkest green areas in the north and southern riverfront carry the heaviest combined burden. Most Medicaid-accepting clinics sit in the low-vulnerability zones.
Plate 10 · Historical redlining & vulnerability hot spots · St. Louis City
1937 HOLC redlining grades overlaid on today's oral health vulnerability hot spots. Neighborhoods once graded "Hazardous" align closely with today's highest-vulnerability tracts. Most clinics fall in areas historically rated "Best." Liked by Esri on LinkedIn.
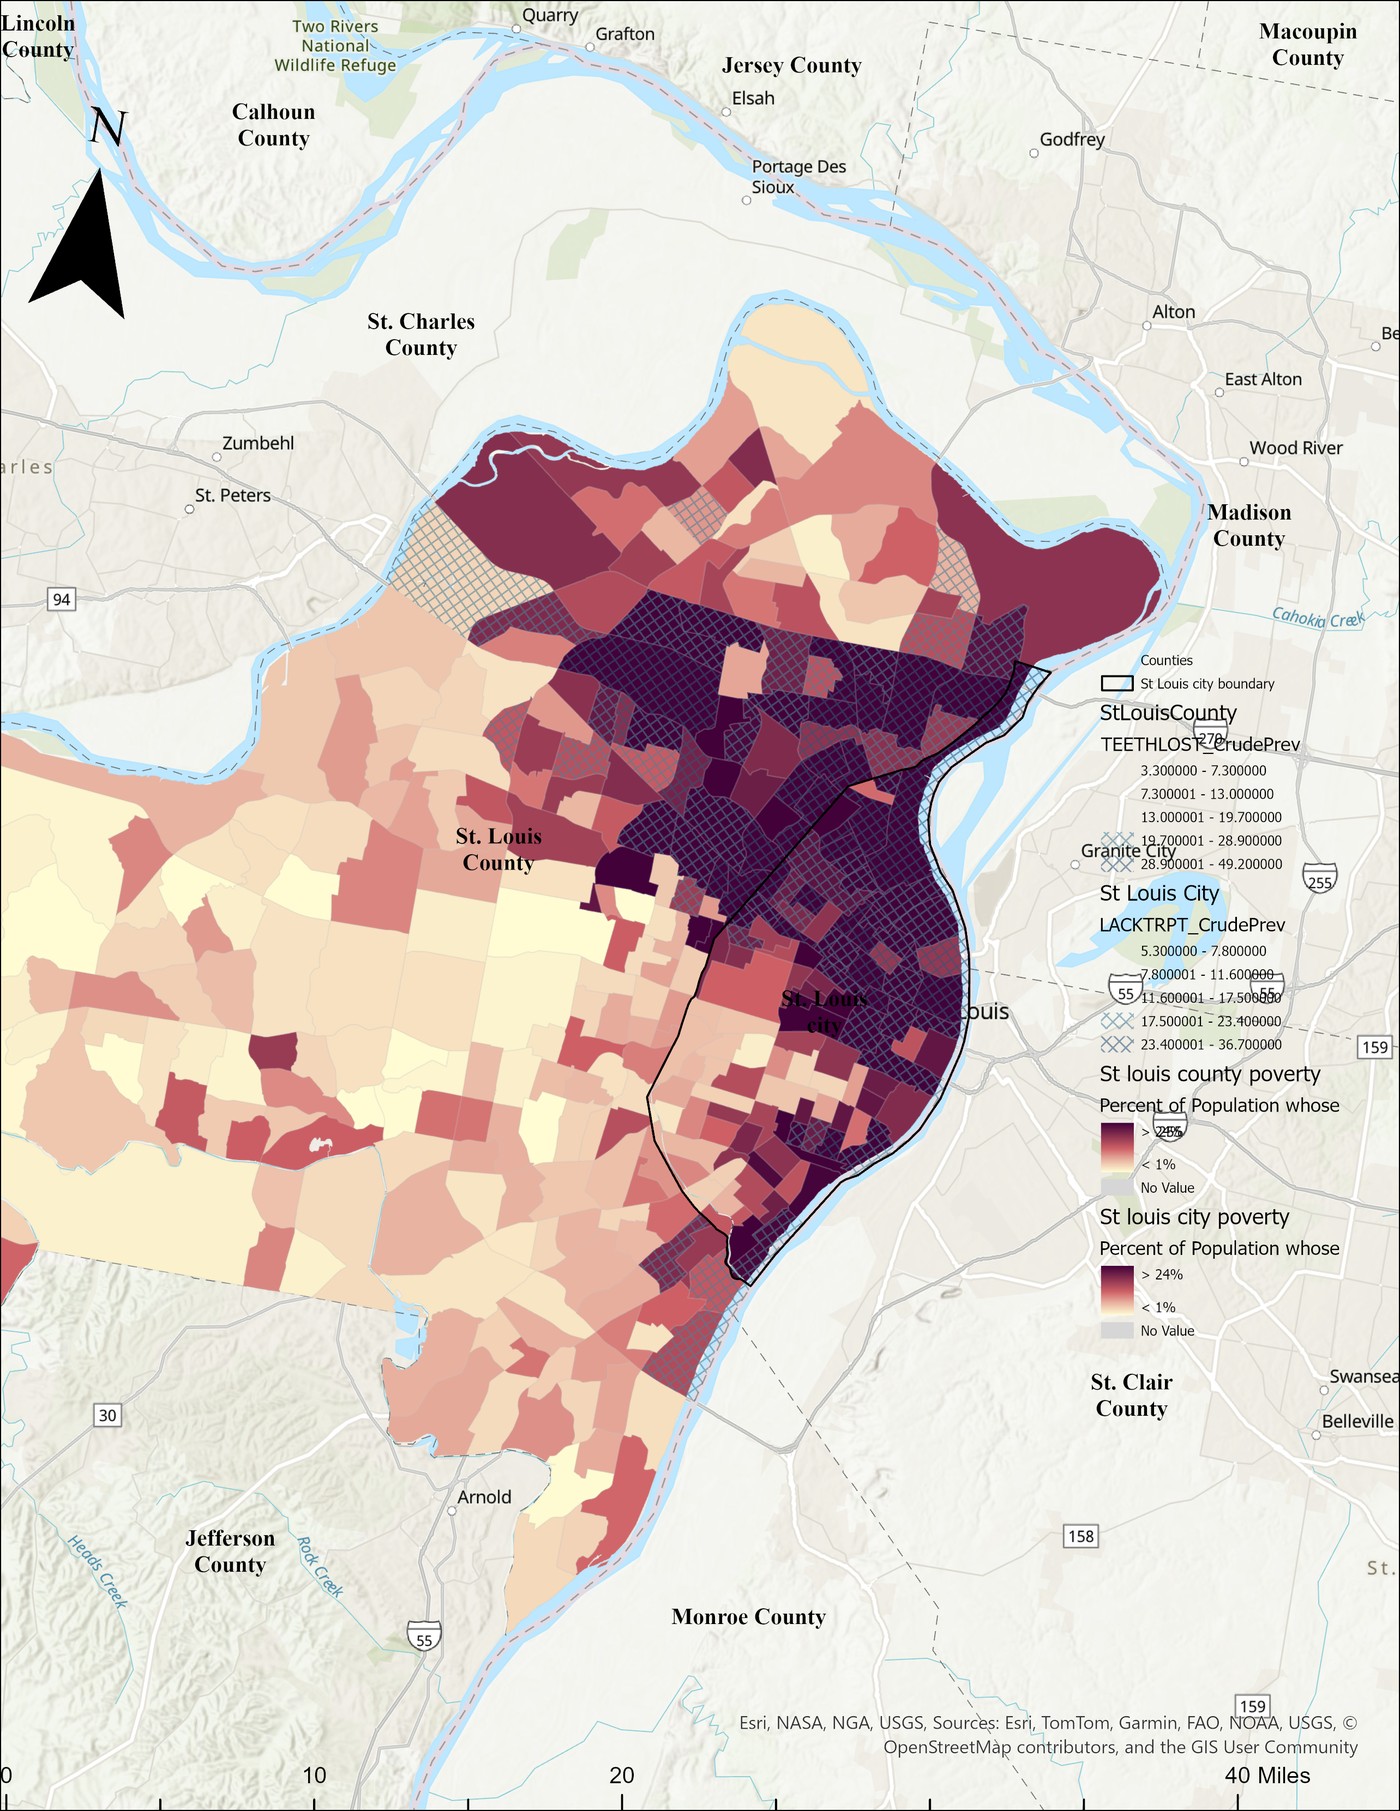
Plate 11 · Poverty & tooth loss — St. Louis City & County
High poverty and high tooth loss don't stop at the city boundary — they spill straight into North County. The city line is just a line on a map. The need is the same on both sides.
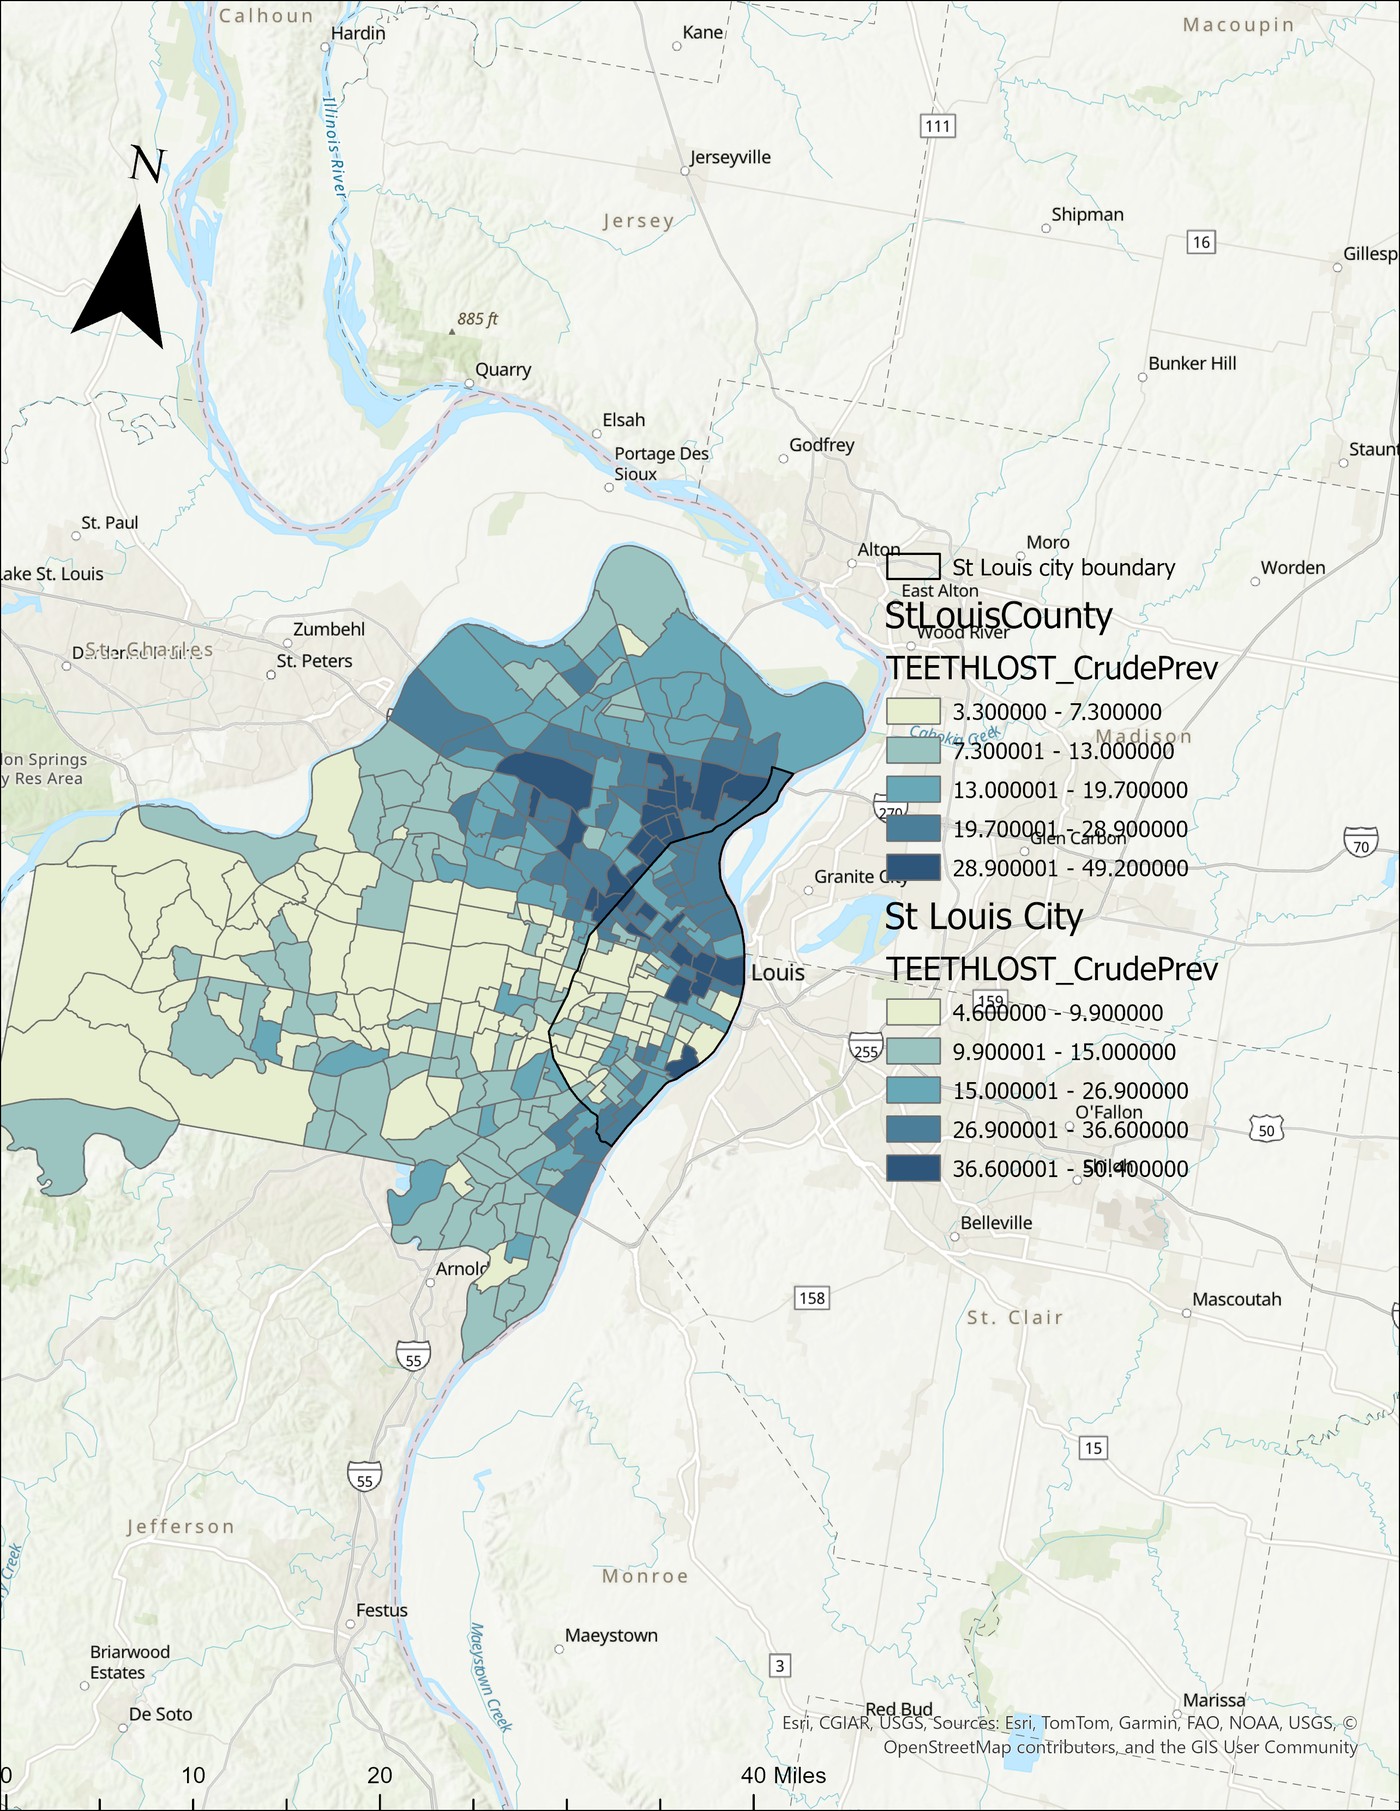
Plate 12 · Tooth loss — St. Louis City & County
Rates up to 50% in North City continue right into North County. South and West County stay light, with rates as low as 3–5%. A tenfold gap within one region.
Plate 13 · Skyline of health inequity — 3D view
Height = tooth loss. Color = overall vulnerability. The tallest towers rise in North St. Louis — the same neighborhoods, the same divide, visible from any angle.
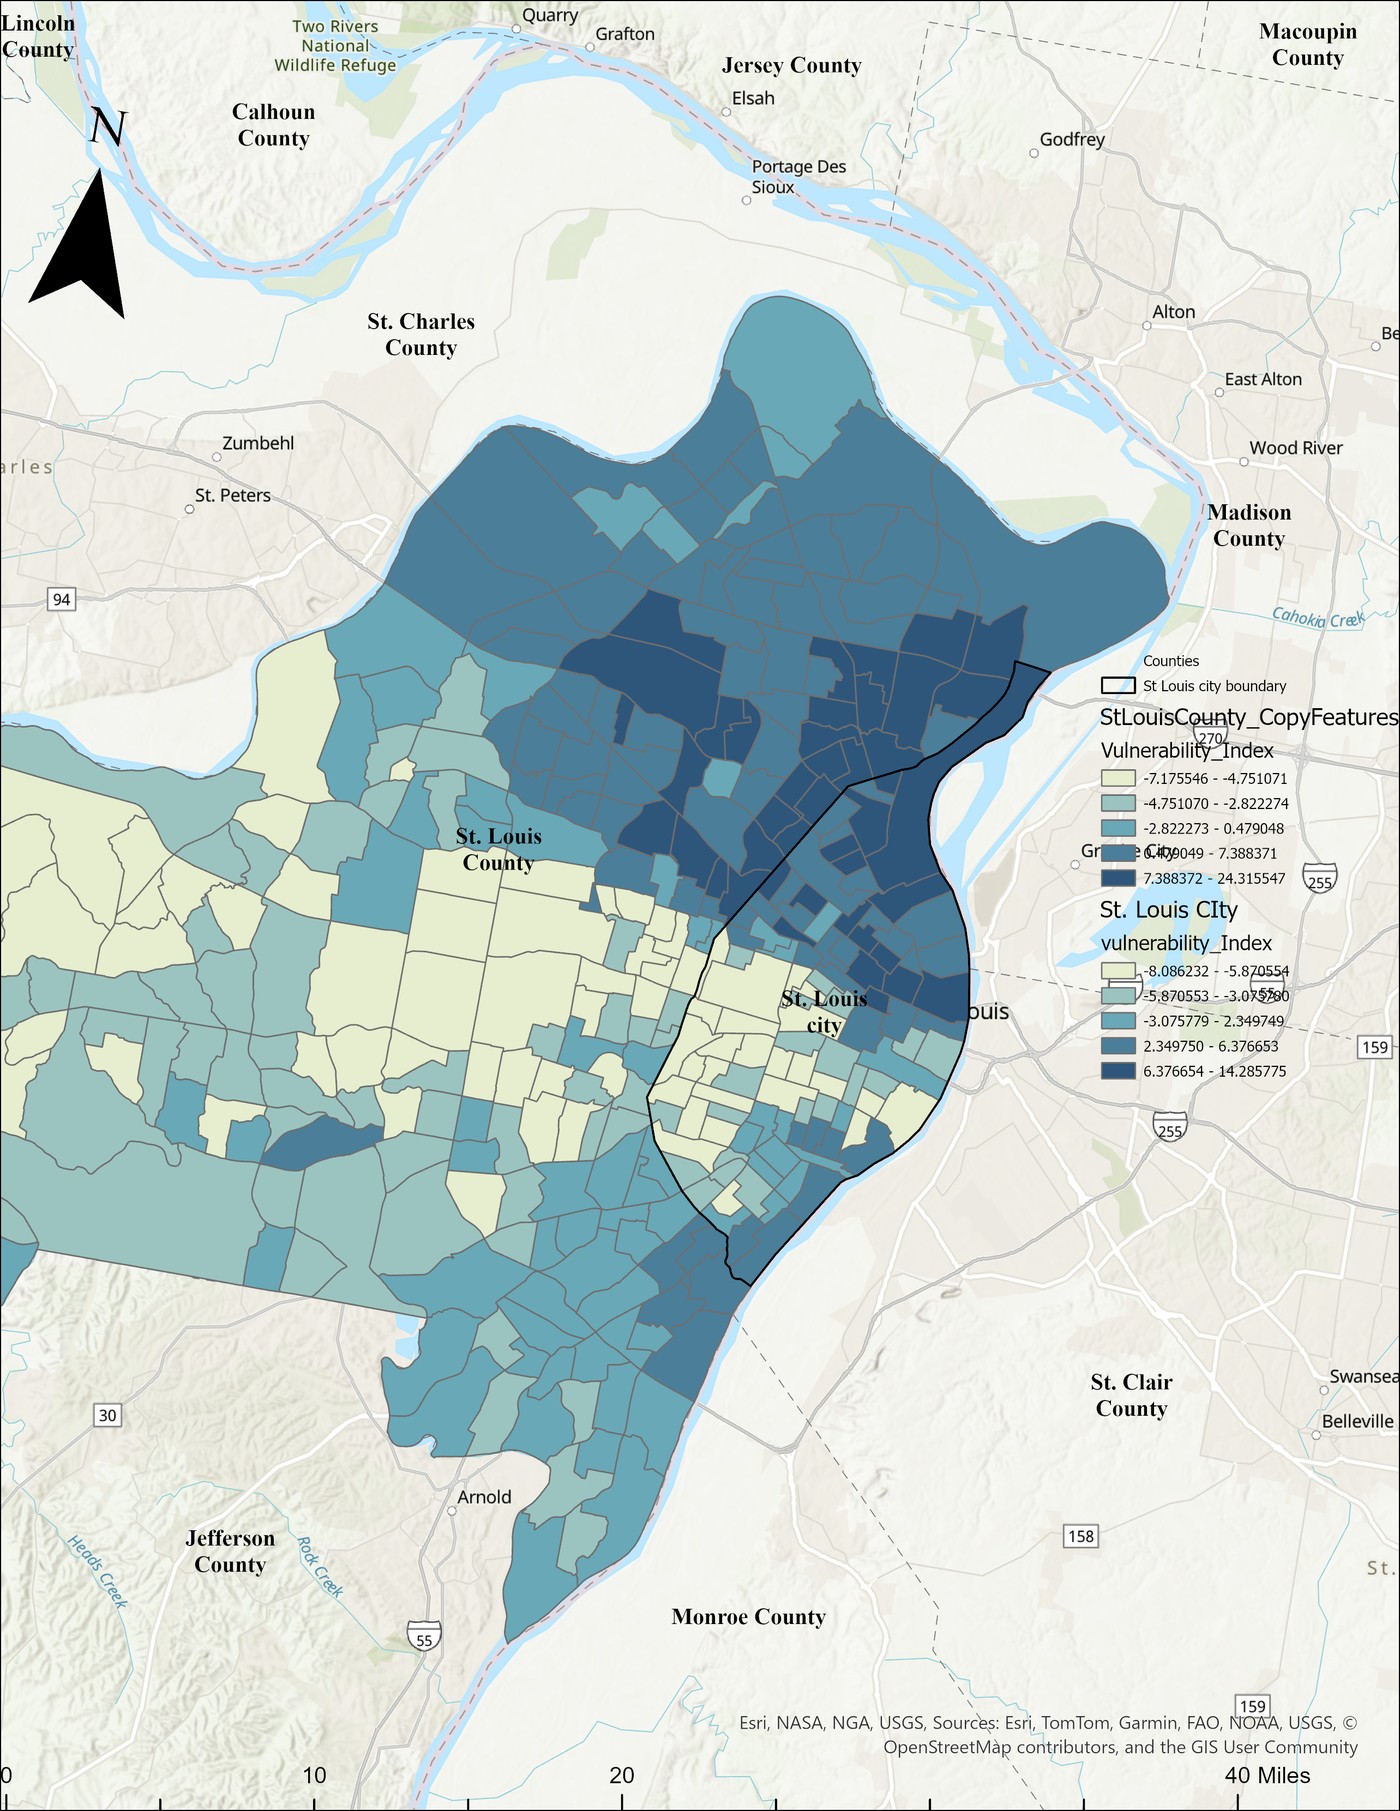
Plate 14 · Oral Health Vulnerability Index · St. Louis City & County
The full index across all 340 census tracts. The most vulnerable neighborhoods on each side of the boundary aren't two separate clusters. They are one continuous band across North City and North County.
MPH Capstone · Saint Louis University, Spring 2026
Assessing Medicaid-accepting dental clinic access for older adults in St. Louis City using ArcGIS Pro, 2020 Census, ACS, and OpenStreetMap data.
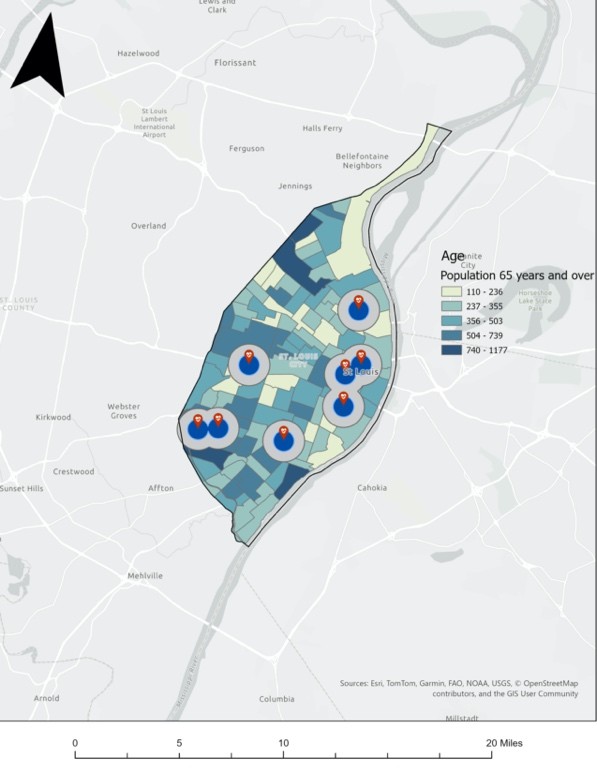
Plate 15 · Older adult population & 1-mile clinic buffers · St. Louis City
Where adults aged 65+ are concentrated across St. Louis City, compared to the 1-mile coverage area around each Medicaid-accepting clinic. The darkest blue tracts fall completely outside any clinic buffer.
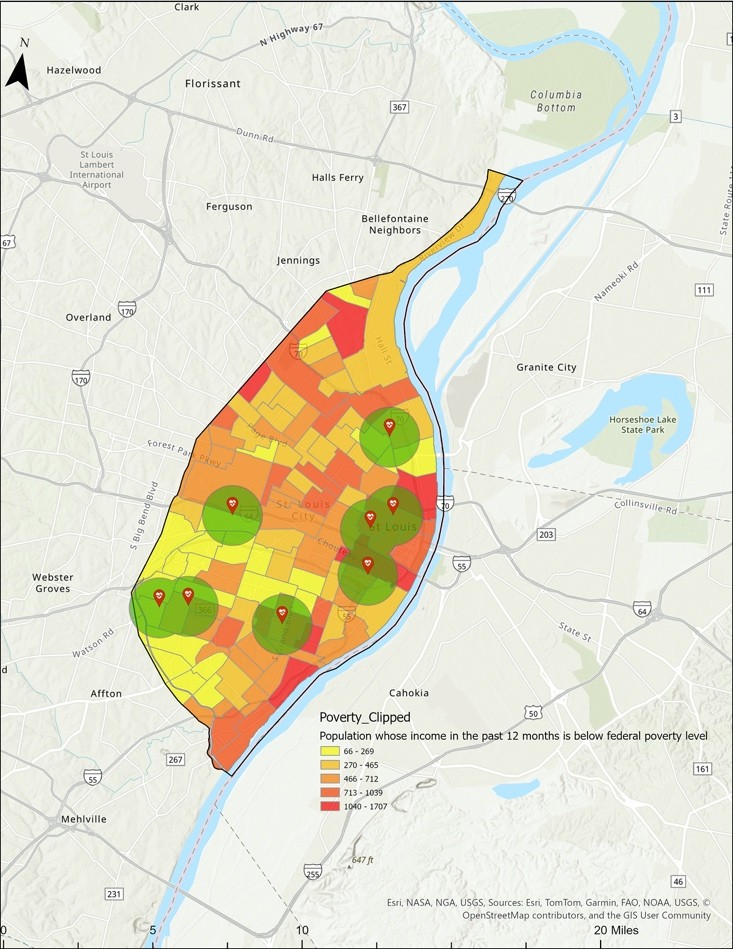
Plate 16 · Poverty concentration & clinic buffers
About 24% of St. Louis City residents live below the federal poverty line. The highest-poverty tracts cluster in the north — the places with the most financial need have the least affordable dental care nearby.
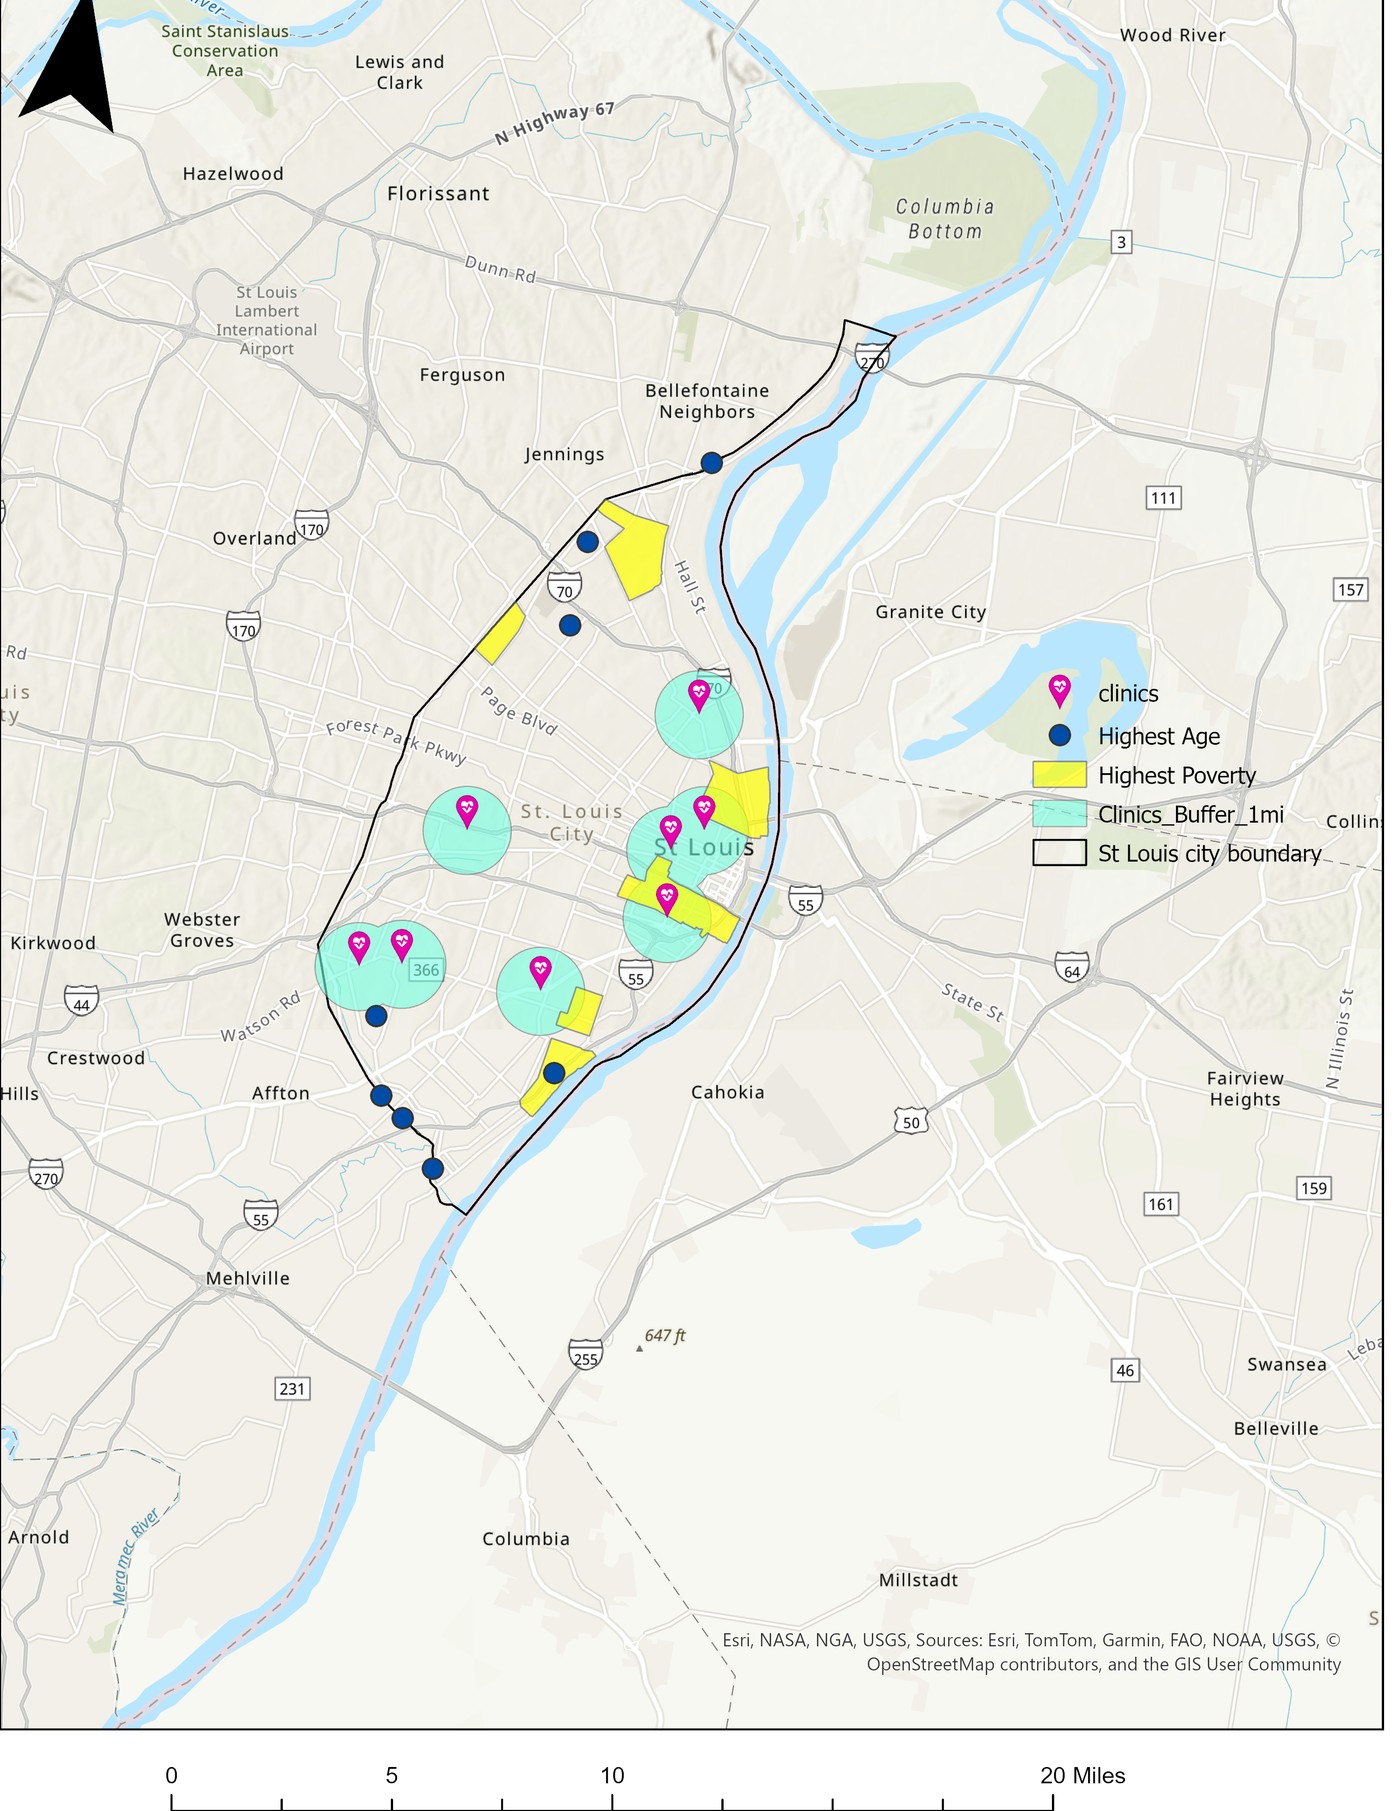
Plate 17 · Poverty & older adults combined
Both layers at once. The north has high poverty and high elderly population — and no Medicaid-accepting clinic within 1 mile. The mismatch is the core finding of this project.
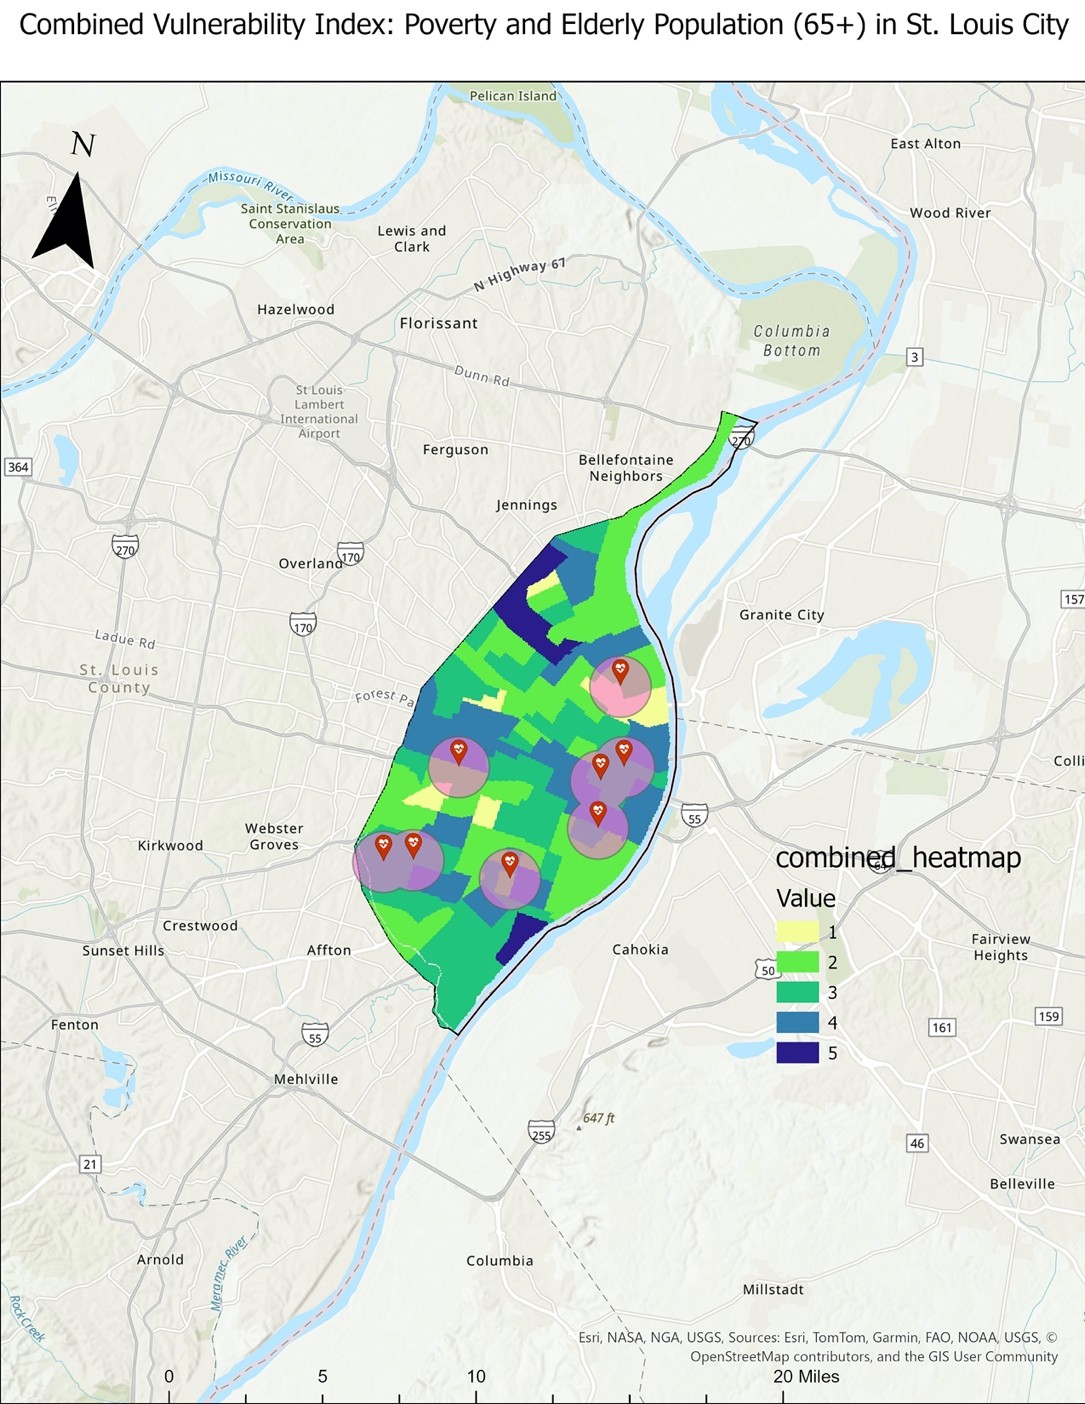
Plate 18 · Combined vulnerability heat map
A composite score (1–5) combining poverty and elderly population per census tract. Tracts scoring 5 are in the north and southeastern riverfront — both completely outside any clinic buffer.
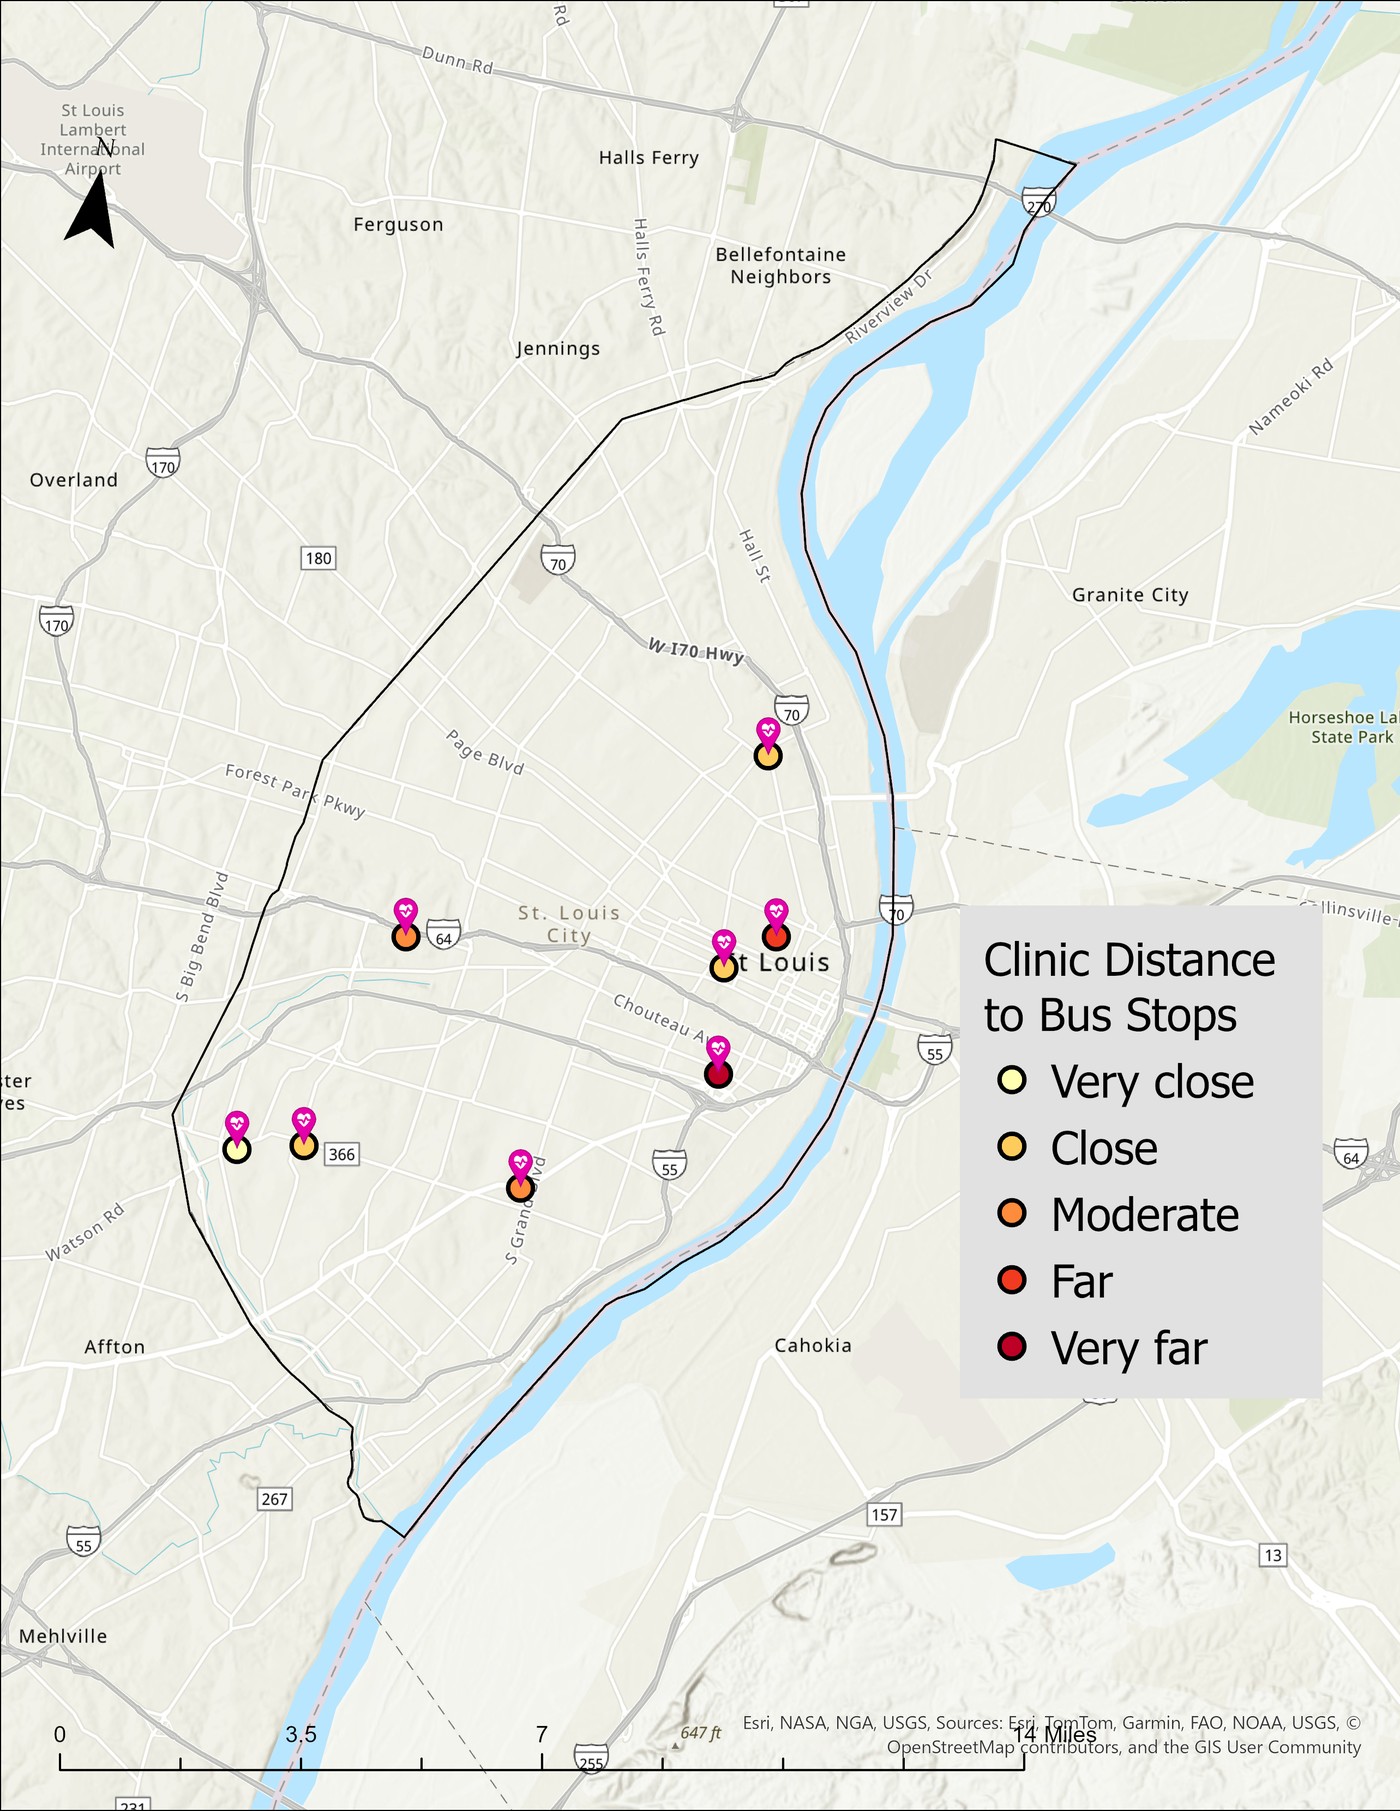
Plate 19 · Clinic distance to nearest bus stop
Most clinics are within a 1–3 minute walk of a bus stop. But one is 0.31 miles away — about 9 minutes on foot — a real barrier for older adults with mobility issues.
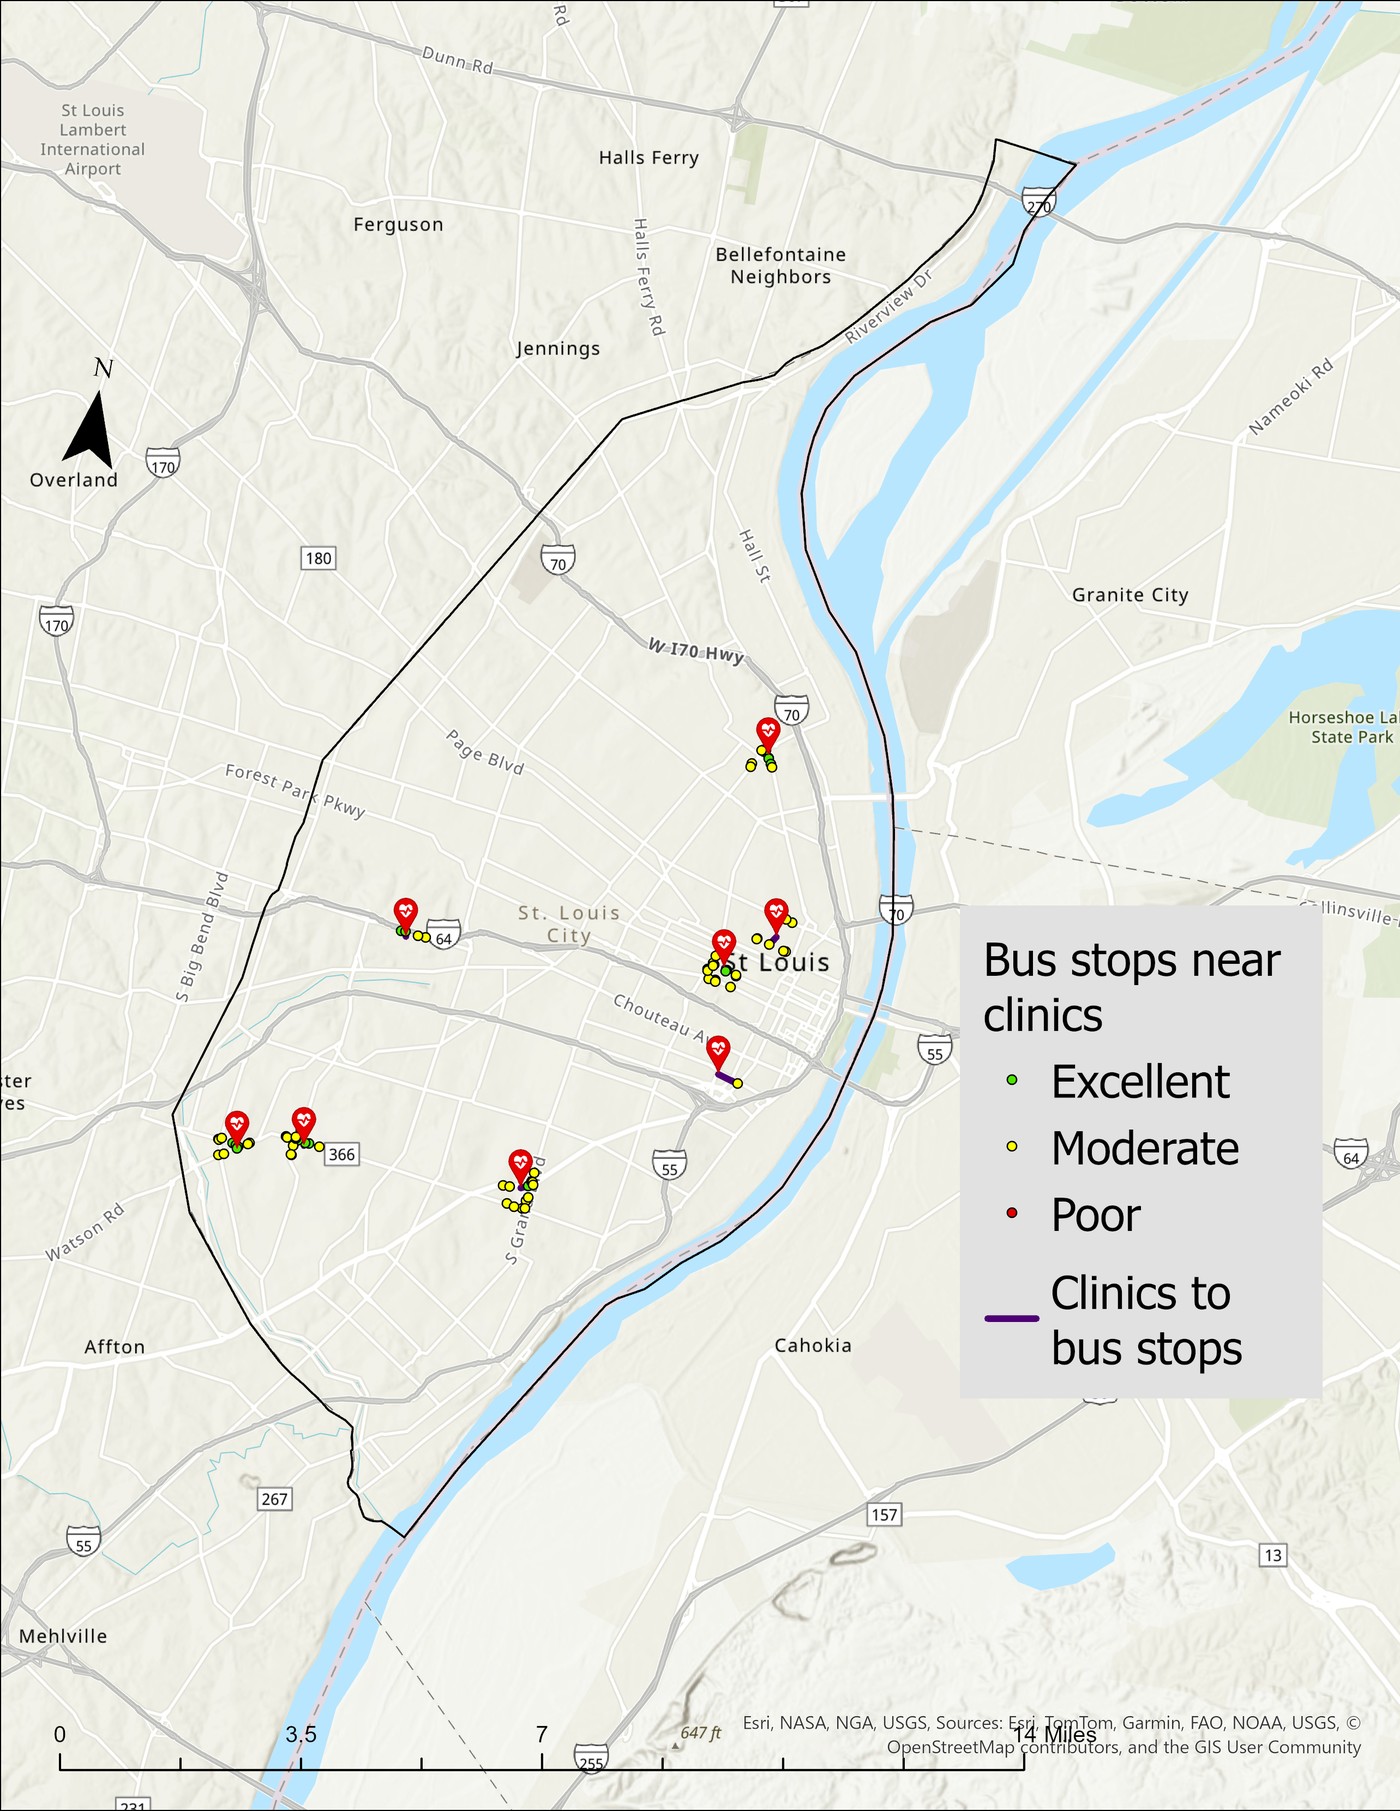
Plate 19b · Bus stop transit quality near clinics · St. Louis City
Quality of bus stop access near each Medicaid-accepting clinic, rated Excellent, Moderate, or Poor based on proximity and connectivity. Most clinics have moderate to poor transit access — a significant barrier for older adults who depend on public transportation to reach dental care.
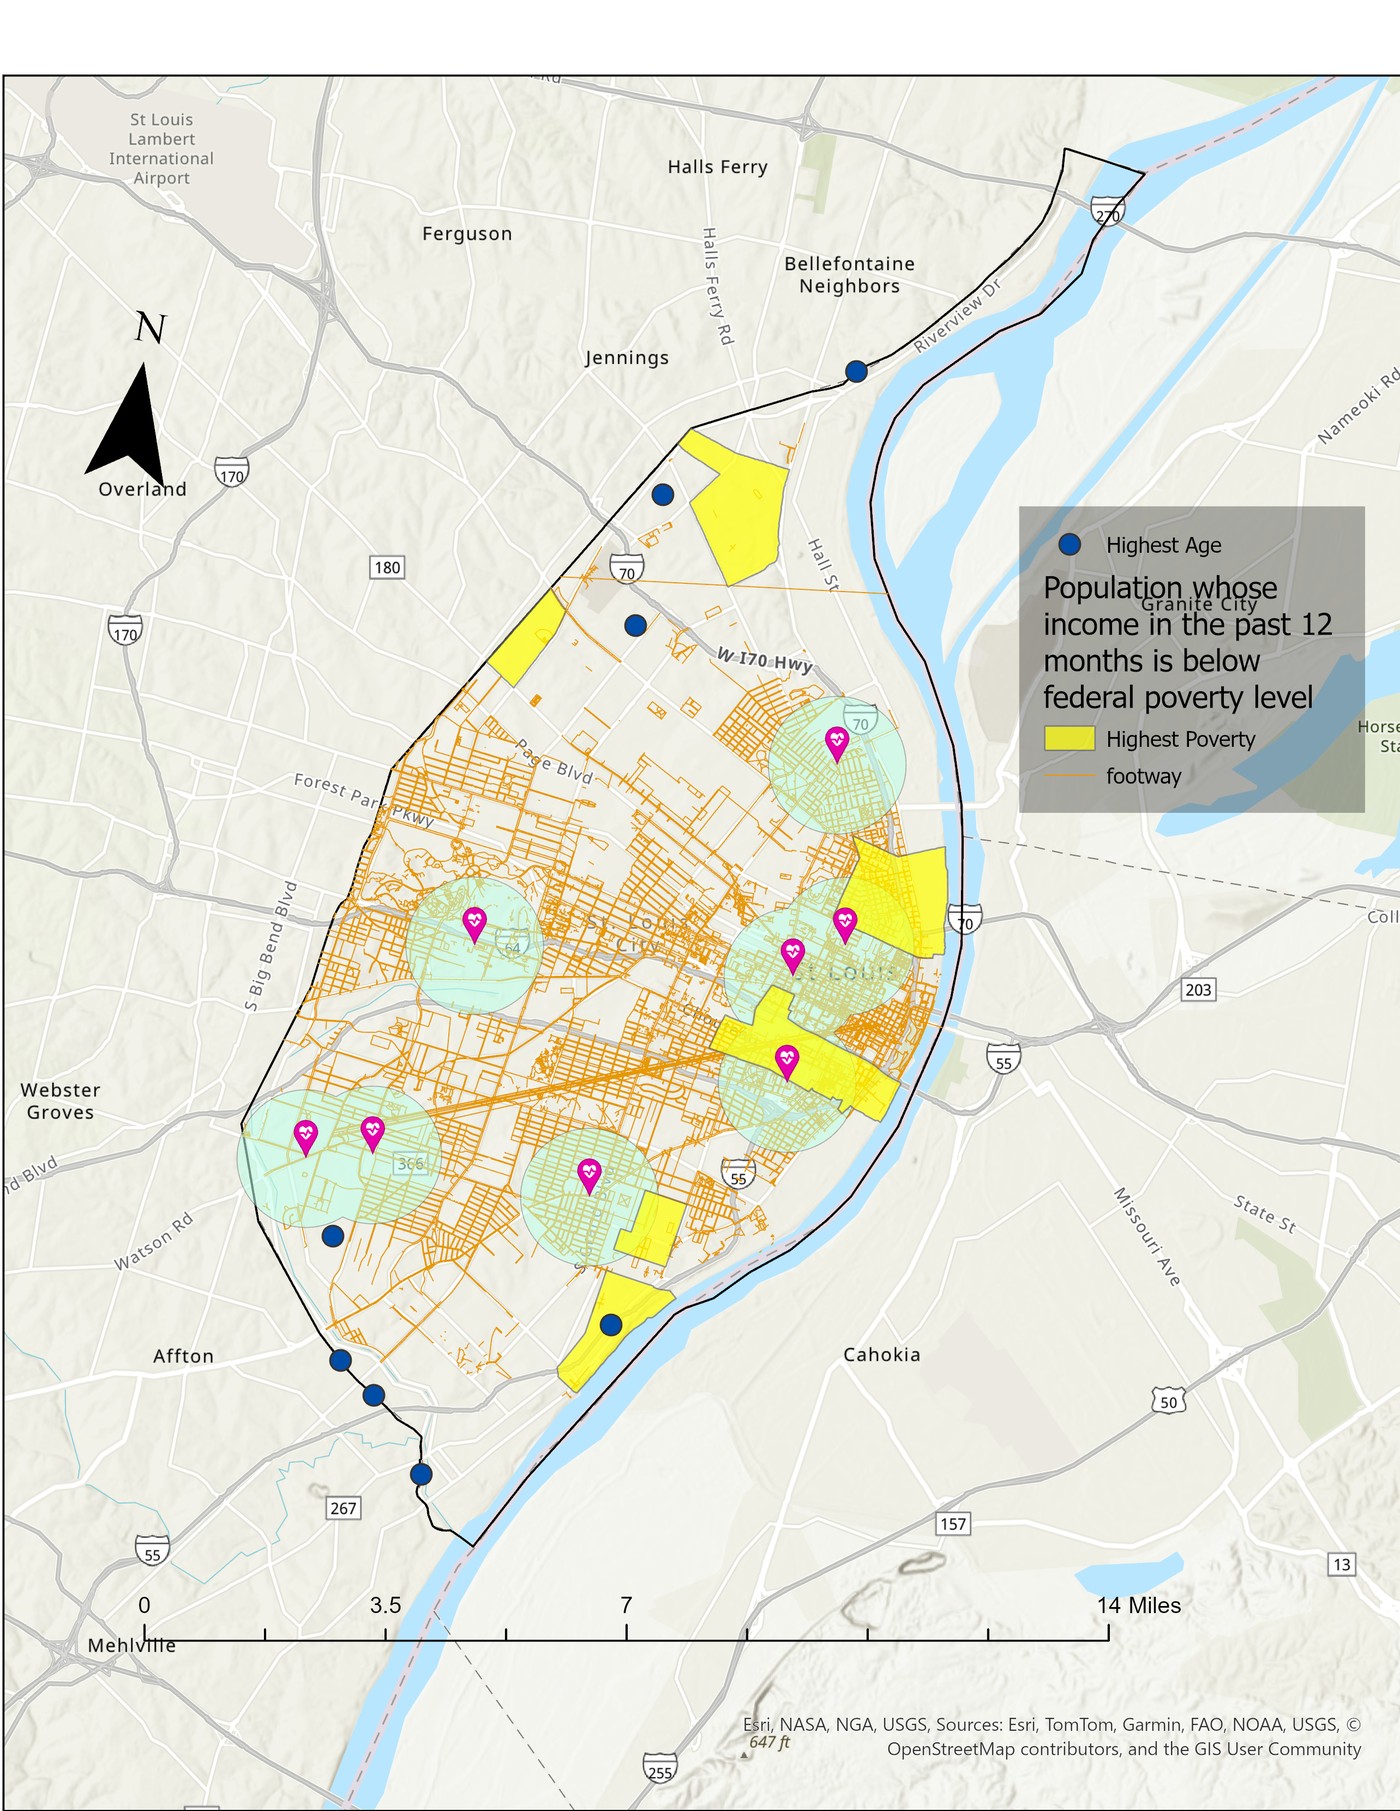
Plate 20 · Sidewalk coverage · St. Louis City
All clinics are within 61 meters of a sidewalk. The bigger problem is the northern neighborhoods — where need is highest, no clinic exists within 1 mile, and the sidewalk network is noticeably thinner.
Presentations
Research is only useful if it reaches the people who can act on it.
POSTER PRESENTATION
Oral Health Disparities and Geographic Access to Dental Care
Illinois Annual Minority Health Conference / Illinois Department of Public Health (IDPH). Certificate of Poster Presentation awarded. 2025.
MPH CAPSTONE PRESENTATION
Who Can Reach a Dentist? Mapping Medicaid Dental Access for Older Adults in St. Louis City
Saint Louis University College for Public Health and Social Justice. MPH Capstone presentation, Spring 2026.
COMMUNITY HEALTH REPORT
Community Needs Assessment — Dental Care Access Among Medicaid-Insured Older Adults
Places for People, St. Louis, MO. MPH Practicum deliverable examining dental care barriers across 16 St. Louis City ZIP codes. Summer 2025.
Contact
Actively seeking roles in public health research, GIS analysis, health equity, and oral health policy. Available on STEM OPT work authorization.